
Image by Author
When working with large DataFrames in Jupyter notebooks, you typically see only the first and last few rows. Need to check a specific value? You write .head(). Want to sort by a column? You write .sort_values(). Looking for a particular row? You write .query(). This constant code writing just to explore your data gets tedious fast.
iTables solves this problem by transforming static DataFrames into interactive tables with built-in search, sorting, and pagination. No extra code required. In this tutorial, you’ll learn how to install iTables, display interactive DataFrames, and customize table behavior to match your workflow.
What Is iTables?
iTables is a Jupyter notebook extension that adds DataTables.js functionality to pandas and polars DataFrames. Instead of static output, you get interactive tables with instant search, clickable column headers for sorting, and pagination controls for browsing large datasets.
The library shines during exploratory data analysis when you need to quickly filter, sort, and browse data without writing code for each action. It’s also valuable when sharing notebooks with colleagues or presenting findings to stakeholders who prefer point-and-click exploration.
However, iTables is read-only, so you can’t edit data directly in the table. It also works best with small to medium datasets. For DataFrames with millions of rows, filter to relevant subsets before displaying.
Installation and Setup
Install iTables using pip, then initialize it in your notebook.
pip install itables
After installation, import the necessary components and activate iTables.
import pandas as pd
from itables import init_notebook_mode, show
from itables.sample_dfs import get_countries

init_notebook_mode(all_interactive=True)
The init_notebook_mode(all_interactive=True) parameter makes every DataFrame automatically display as interactive. If you set it to False, you’ll need to use show(df) to selectively make specific tables interactive.
Your First Interactive DataFrame
Load the sample country dataset and display it.
df = get_countries(html=False)
df
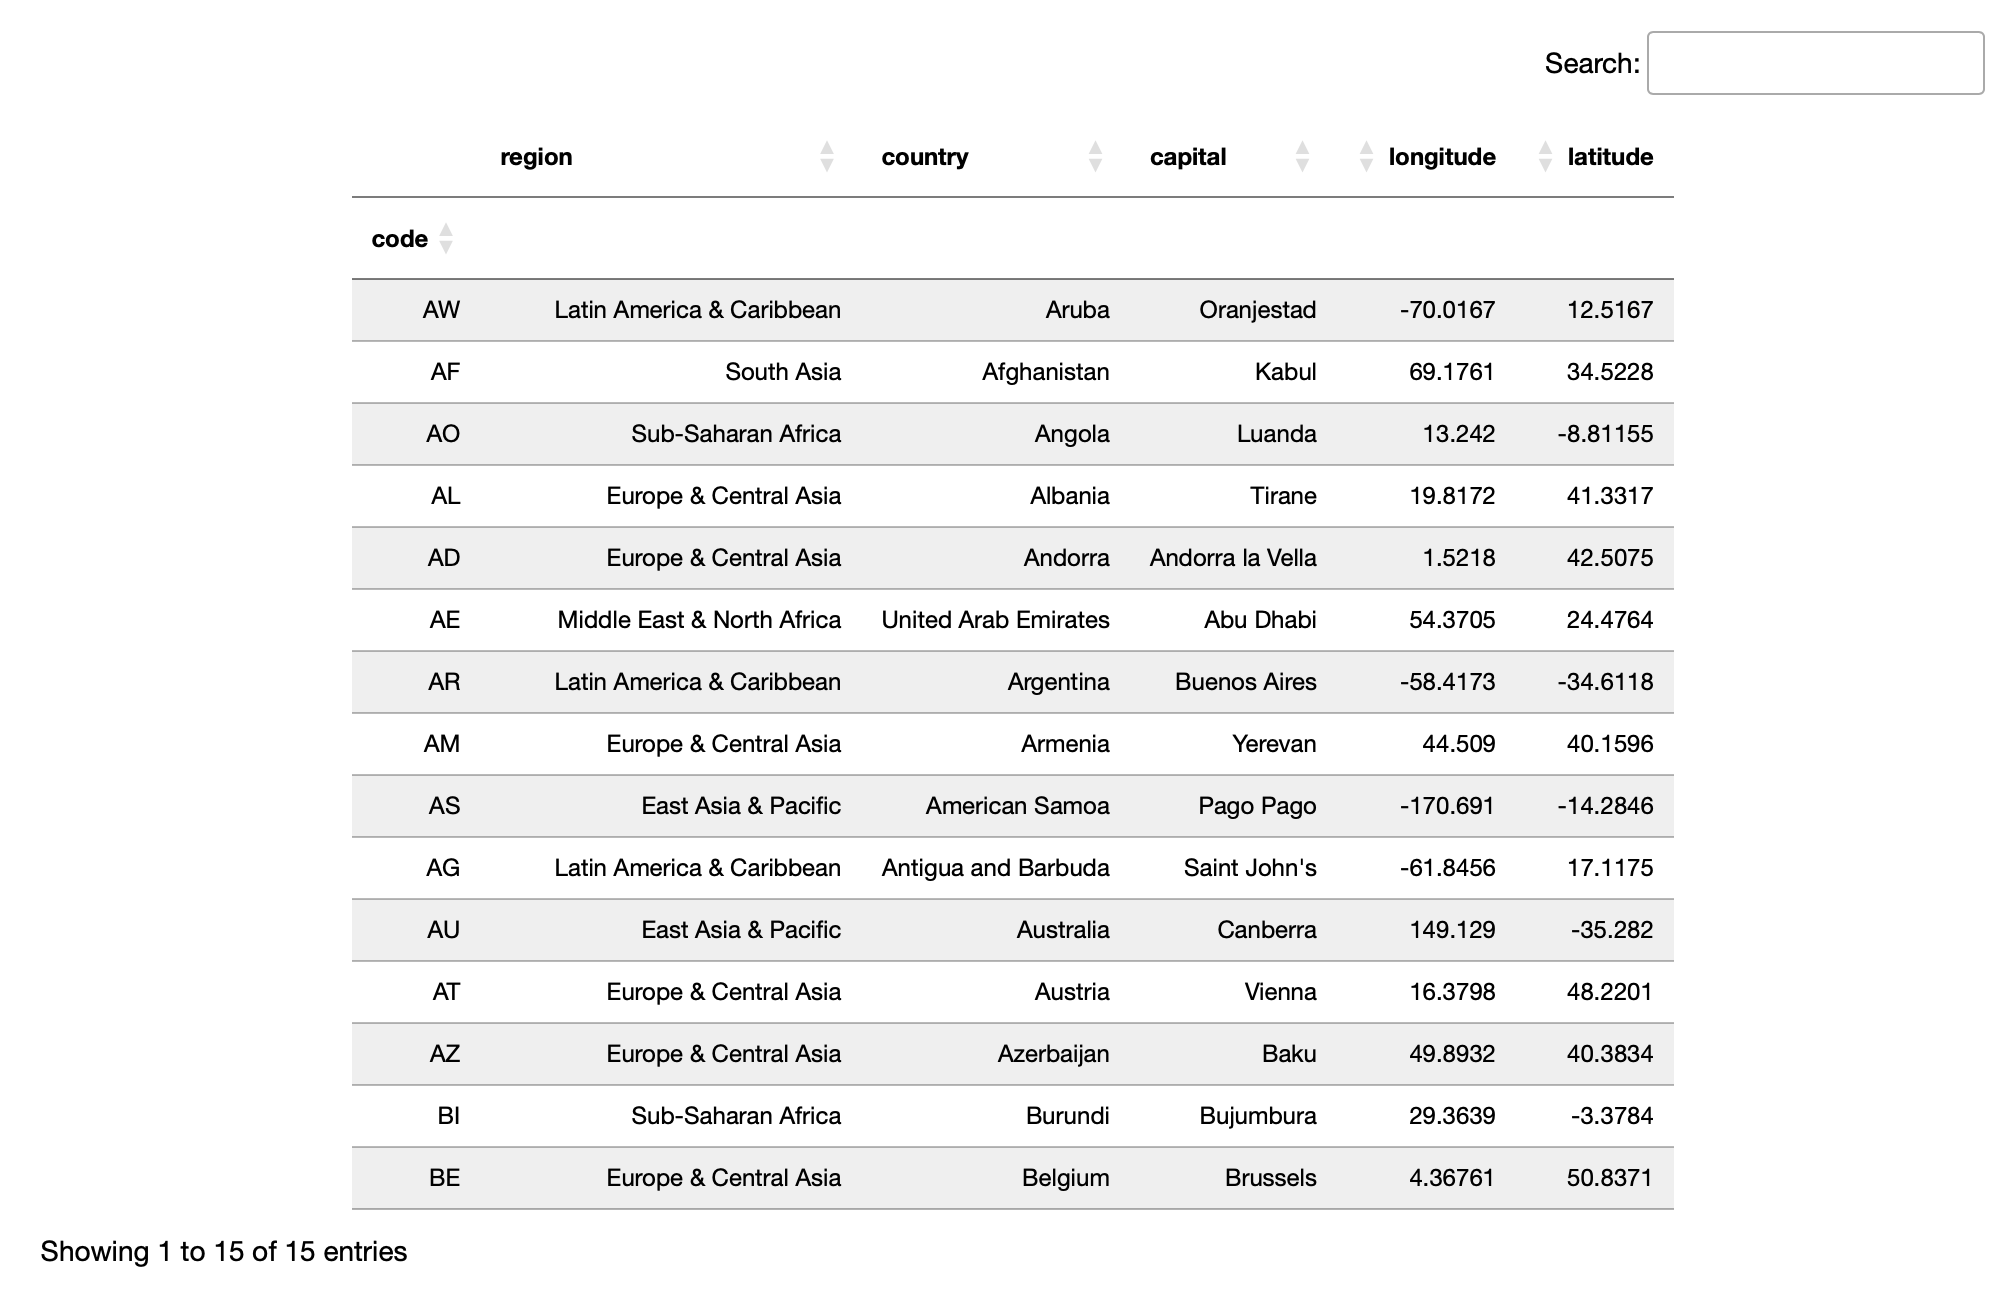
Since we initialized iTables with all_interactive=True, the DataFrame displays as an interactive table automatically.

The table includes several interactive features. A search box appears at the top right where you can type to filter across all columns. Column headers are clickable: click once for ascending sort, twice for descending, and a third time to reset to the original order. Pagination controls at the bottom let you navigate through pages, and a status message shows “Showing X to Y of Z entries” so you know your position in the dataset.
Try clicking the “capital” column header to see countries sorted alphabetically by capital cities. The sort happens instantly without running any Python code. Type “United” in the search box to find all countries with “United” in their name. This interactivity required zero additional code beyond initialization. This instant filtering saves you from writing multiple .query() or .loc[] statements. Instead of coding df[df[‘name’].str.contains(‘United’)], just type in the search box. It’s especially helpful when you’re not sure exactly what you’re looking for yet.
Controlling Pagination
Customize how many rows appear per page and give users options to change the page size.
show(df, lengthMenu=[5, 10, 25, 50, 100])
This creates a dropdown menu where users can choose to display 5, 10, 25, 50, or 100 rows per page.

Set a default page size that matches your analysis needs.
show(df, paging=True, pageLength=25)
A pageLength of 25 works well for most analysis tasks, though you might prefer 10 for presentations or 50 for detailed work. You’ll notice the table loads faster with pagination enabled. The browser only renders 25 rows at a time instead of trying to display thousands simultaneously. This makes a huge difference once you’re working with datasets beyond a few hundred rows.
For small DataFrames where everything fits on one screen, disable pagination entirely.
small_df = df.head(15)
show(small_df, paging=False)
Pagination becomes essential for datasets over 1,000 rows because it keeps your notebook responsive by only rendering visible data. Without pagination, rendering thousands of rows would slow down your browser significantly.
Customizing Search and Sorting
Control which interactive features are enabled based on your needs.
show(df,
     searching=True,
     ordering=True,
     paging=True,
     scrollX=True,
     scrollY='400px')
Each parameter controls a specific feature. The searching parameter enables the search box, ordering enables column sorting, and paging enables pagination. The scrollX=True setting adds horizontal scrolling for wide tables, while scrollY=’400px’ sets a fixed table height with vertical scrolling.
Disable search when presenting finalized results.
show(df, searching=False)
You might disable searching when presenting finalized results where exploration isn’t needed, disable ordering when row order must be preserved — such as in time-series data — or enable scrollX for DataFrames with more than 10 columns.
Here’s a practical tip: if you’re analyzing time-series data where chronological order matters, disable ordering to prevent accidental sorting. Similarly, when you’ve carefully arranged rows for a specific comparison, you don’t want someone accidentally clicking a header and losing that arrangement.
Combine settings for a presentation-ready configuration.
show(df,
     pageLength=10,
     lengthMenu=[10, 25, 50],
     searching=False,
     scrollX=True)

For presentations, setting pageLength=10 and searching=False keeps focus on the data rather than exploration tools.
Working With Large Datasets
iTables handles thousands of rows smoothly, but very large DataFrames require consideration. By default, iTables limits data sent to the browser to approximately 64 KB. For larger datasets, only a subset is displayed and you may see a warning indicating that not all rows are shown.
Increase the limit if needed.
import itables.options as opt
opt.maxBytes = 128000
Setting maxBytes to 0 disables the limit completely, but use this carefully.
Disabling maxBytes can freeze your browser with very large DataFrames. For datasets with millions of rows, filter to relevant subsets before displaying rather than trying to show everything at once.
Real-World Example
Explore the country dataset using balanced interactive settings.
df = get_countries(html=False)

show(df,
     lengthMenu=[10, 25, 50, 100],
     pageLength=25,
     scrollX=True)
The table displays with 25 rows per page, and users can adjust that via the dropdown menu.

All of this interactivity required just three lines: import, initialize, and display. No custom JavaScript, no complex configuration, and no repeated pandas methods. Notice how the table stays responsive even as you sort and search. This responsiveness comes from DataTables.js handling the interaction client-side. Your Python kernel isn’t running anything, it’s all happening in the browser.
Conclusion
iTables transforms static DataFrames into interactive tables with minimal code. It excels during exploratory data analysis in Jupyter notebooks, when sharing analysis with colleagues and when presenting to stakeholders who appreciate point-and-click exploration.
Keep in mind that iTables is read-only, so you can’t edit data in the table itself. It also works best for small to medium datasets under 100,000 rows. For larger datasets, filter first or consider alternatives designed for server-side processing. Now that you understand the basics, you can explore more advanced features like export buttons, custom formatters, and integration with dashboard applications.
