Matplotlib双轴(TwinAxes)

Matplotlib双轴(TwinAxes) 首页 / Matplotlib入门教程 / Matplotlib双轴(TwinAxes)

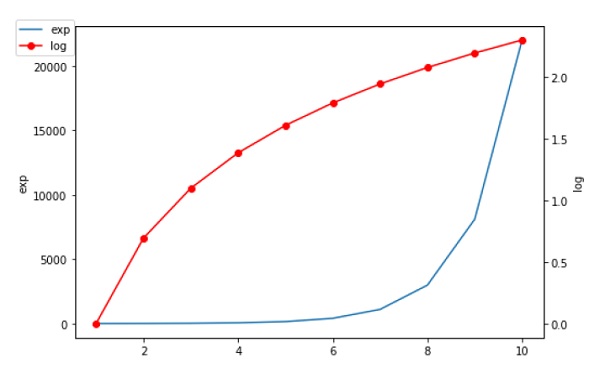
在图形中两个x或y轴被认为是有用的,此外,如果想绘制具有不同单位的曲线时, Matplotlib可以通过twinxand twiny函数支持此功能。

在以下示例中,该图具有两个y轴,一个显示exp(x),另一个显示log(x)-

链接:https://www.learnfk.comhttps://www.learnfk.com/matplotlib/matplotlib-twin-axes.html

来源:LearnFk无涯教程网

import matplotlib.pyplot as plt
import numpy as np
fig = plt.figure()
a1 = fig.add_axes([0,0,1,1])
x = np.arange(1,11)
a1.plot(x,np.exp(x))
a1.set_ylabel('exp')
a2 = a1.twinx()
a2.plot(x, np.log(x),'ro-')
a2.set_ylabel('log')
fig.legend(labels = ('exp','log'),loc='upper left')
plt.show()
Twin Axes

祝学习愉快!(内容编辑有误?请选中要编辑内容 -> 右键 -> 修改 -> 提交!)

教程推荐

结构写作力 -〔李忠秋〕

编程高手必学的内存知识 -〔海纳〕

Go 并发编程实战课 -〔晁岳攀(鸟窝)〕

TensorFlow 2项目进阶实战 -〔彭靖田〕

DevOps实战笔记 -〔石雪峰〕

全栈工程师修炼指南 -〔熊燚(四火)〕

Android开发高手课 -〔张绍文〕

深入拆解Java虚拟机 -〔郑雨迪〕

从0开始学架构 -〔李运华〕

好记忆不如烂笔头。留下您的足迹吧 :)