

Your housing market command center.
Everything you need. Nothing you don’t.
Purpose-built for agents, brokers, and investors who want to stay ahead of the Housing Market.
Real-Time Market Data
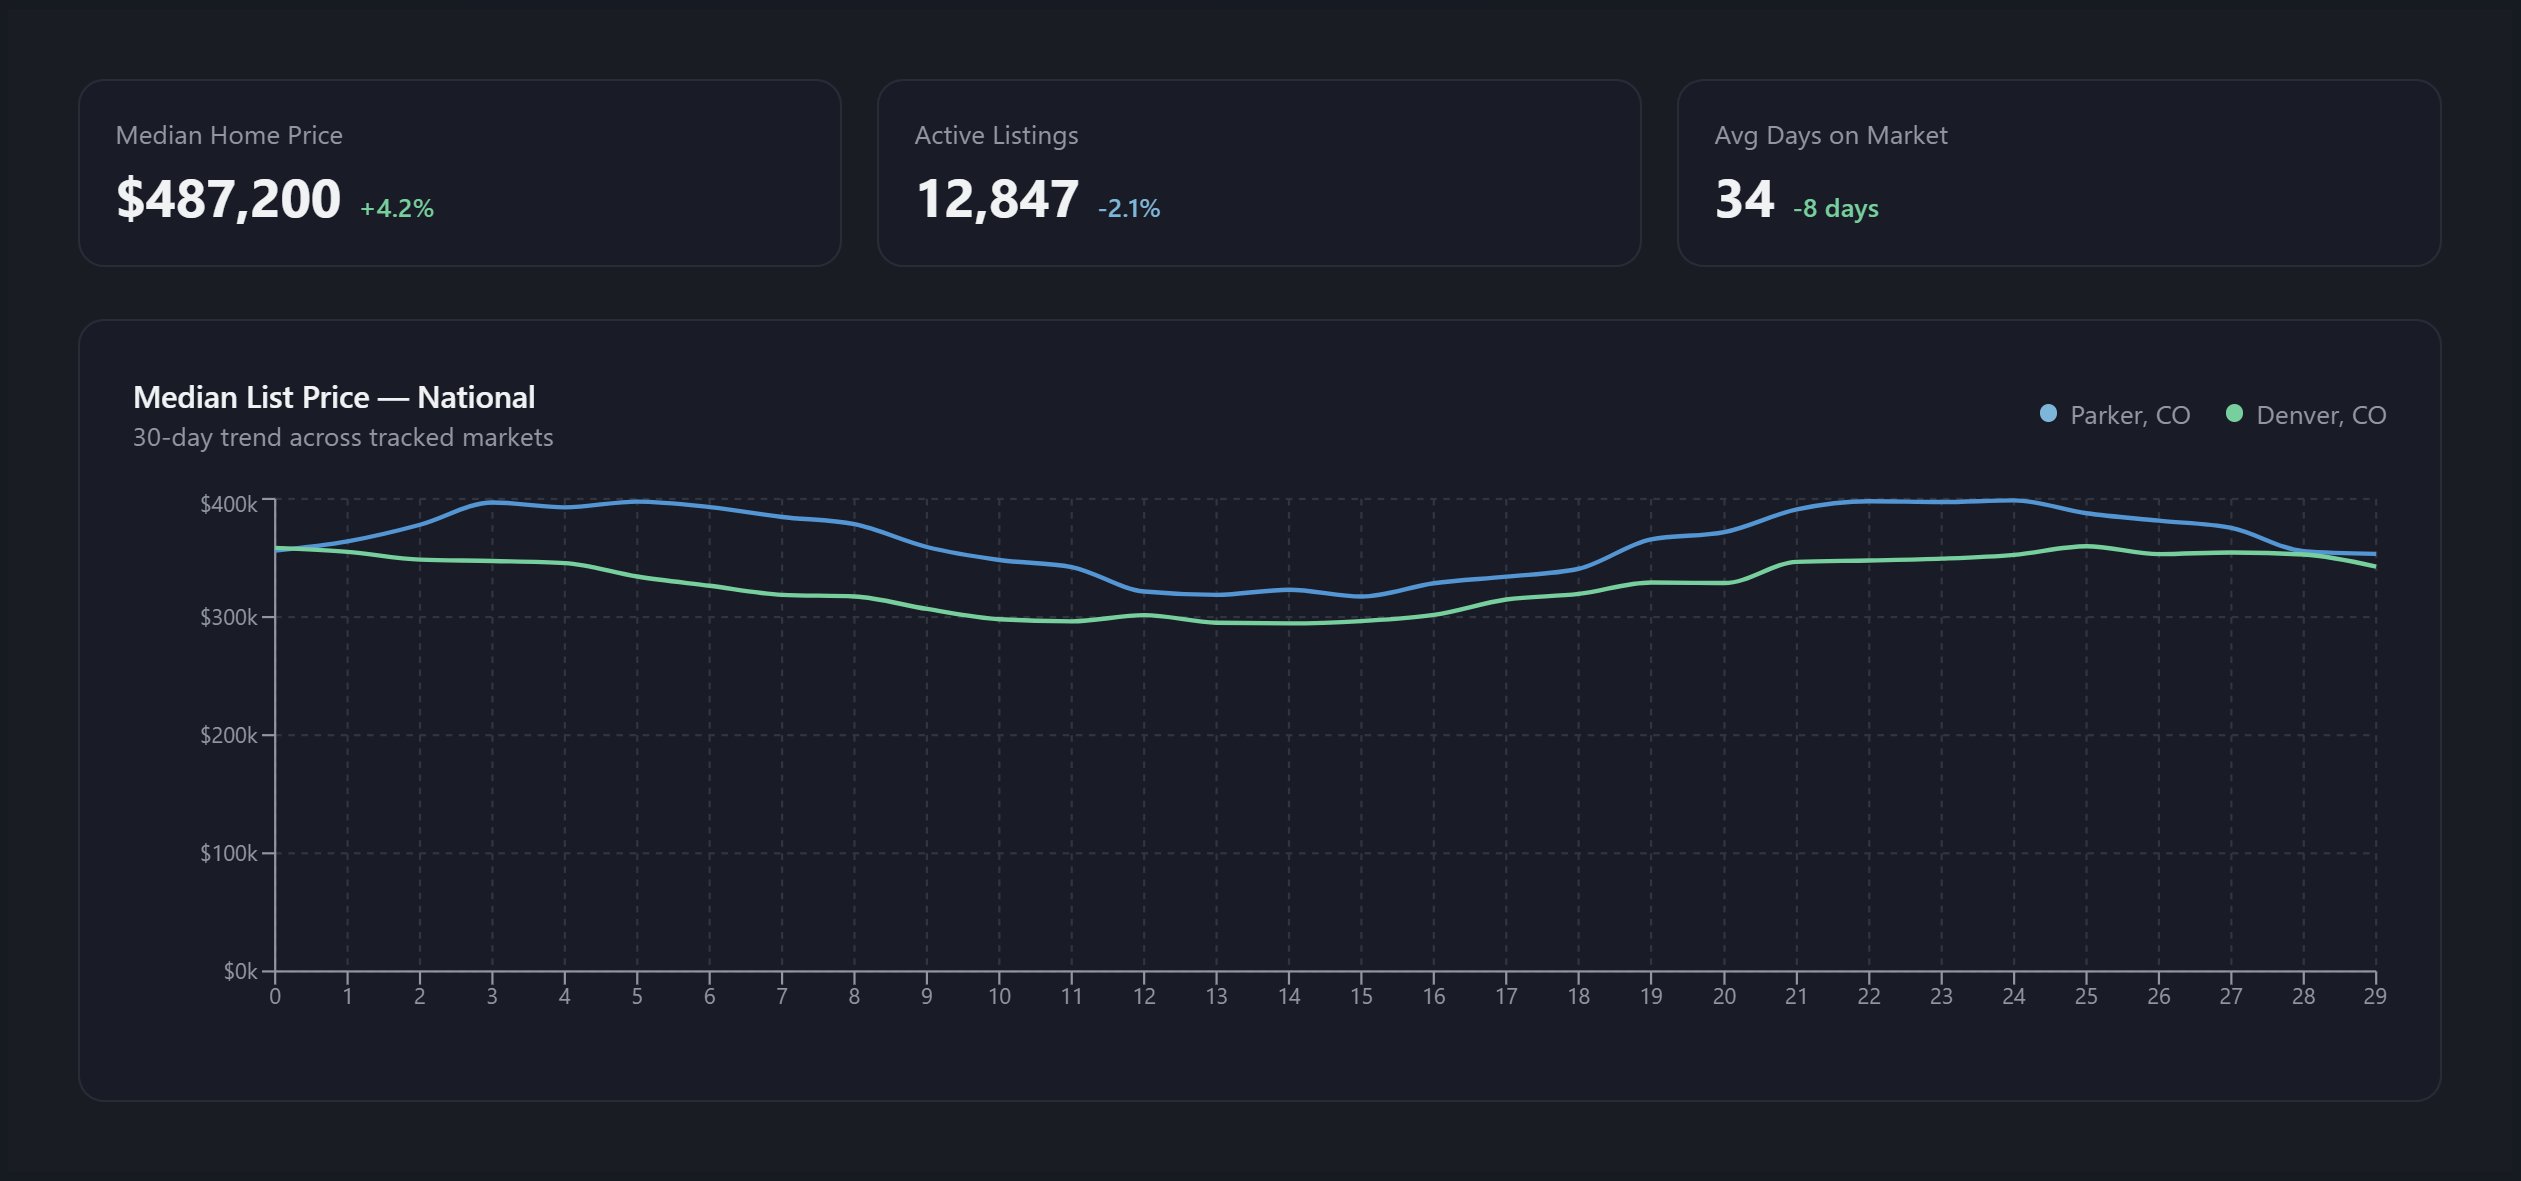
Track median prices, inventory levels, and market velocity across any zip code in the US.
Custom Dashboard Blocks
Build your perfect view with drag-and-drop widgets. Charts, tables, news — all customizable.
Personalized News Feed
Stay ahead with curated industry news and AI-generated summaries of market-moving stories.
Multi-Location Tracking
Compare markets side-by-side. Track multiple cities and zips — wherever your clients are.
SEC Filings Monitor
Track public company filings from Eddie and other major players in real estate.
AI Powered Instant Insights
One-click AI summaries turn complex data into actionable talking points for your clients.
Data that moves markets.
Deep analytics across every metric that matters — visualized beautifully.
Listing vs Pending
Active inventory compared to pending sales

Monthly Sales Volume
Total transactions by month — Parker, CO

30-Year Mortgage vs 10-Year Treasury Spread
Weekly average from Freddie Mac PMMS
- ● 2024
- ● 2025

Ready to level up your market intel?
Join thousands of Housing Market professionals already using HousingWire Intelligence to close more deals with better data.
©2006-2026 HW Media, LLC. All rights reserved.
