


A dead-simple JavaScript Gantt Chart library to visualize your workflow and scheduled tasks in a timeline style Gantt Chart.
How to use it:
1. Install the package and install the simple-gantt-chart as a module.
# NPM
$ npm install simple-gantt-chart --save
import {GanttChart} from 'simple-gantt-chart'2. Or directly include the following JavaScript and CSS files on the HTML page.
<link rel="stylesheet" href="/path/to/dist/index.css" />
<script src="/path/to/dist/index.min.js"></script>
3. Or from a CDN.
<link rel="stylesheet" href="https://cdn.jsdelivr.net/npm/simple-gantt-chart@latest/dist/index.css" />
<script src="https://cdn.jsdelivr.net/npm/simple-gantt-chart@latest/dist/index.min.js"></script>
4. Create an element that serves as the container for the Gantt chart.
<div id="myGantt"></div>
5. Initialize the library and create a new Gantt chart instance.
const gantt = new ganttchart.GanttChart();
6. Push your data to the Gantt chart.
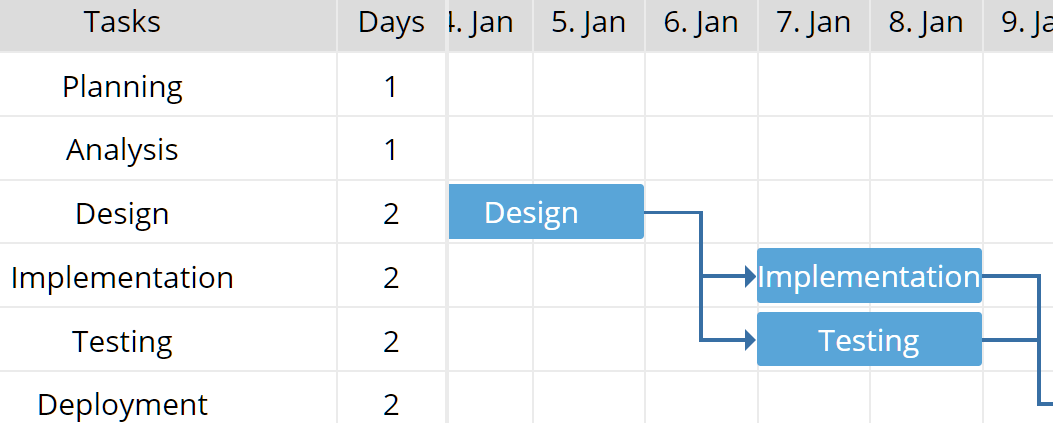
gantt.setData([
  {id: 1, text: 'Planning', startDate: new Date('2020-01-01'), days: 1},
  {id: 2, text: 'Analysis', startDate: new Date('2020-01-02'), days: 1, dependencies: [1]},
  {id: 3, text: 'Design', startDate: new Date('2020-01-04'), days: 2, dependencies: [2]},
  {id: 4, text: 'Implementation', startDate: new Date('2020-01-07'), days: 2, dependencies: [3]},
  {id: 5, text: 'Testing', startDate: new Date('2020-01-07'), days: 2, dependencies: [3]},
  {id: 6, text: 'Deployment', startDate: new Date('2020-01-10'), days: 2, dependencies: [4, 5]},
]);
7. Render the Gantt chart on your project.
gantt.render(document.getElementById('gantt_here'));See Also:
 Interactive Gantt Charts in Vanilla JavaScript – VikCraft Gantt
 Draggable & Resizable SVG Gantt Chart – Frappe Gantt
 Generate Interactive SVG/Canvas Gantt Charts With JavaScript
 Versatile Gantt Chart Component – jsGantt
 Simple Interactive Gantt Chart Creator
 Easy Gantt Chart Builder In JavaScript – Gantt.js
 Parallel Timelines Chart With JavaScript And SVG
 Dynamic Gantt Chart Web Component