


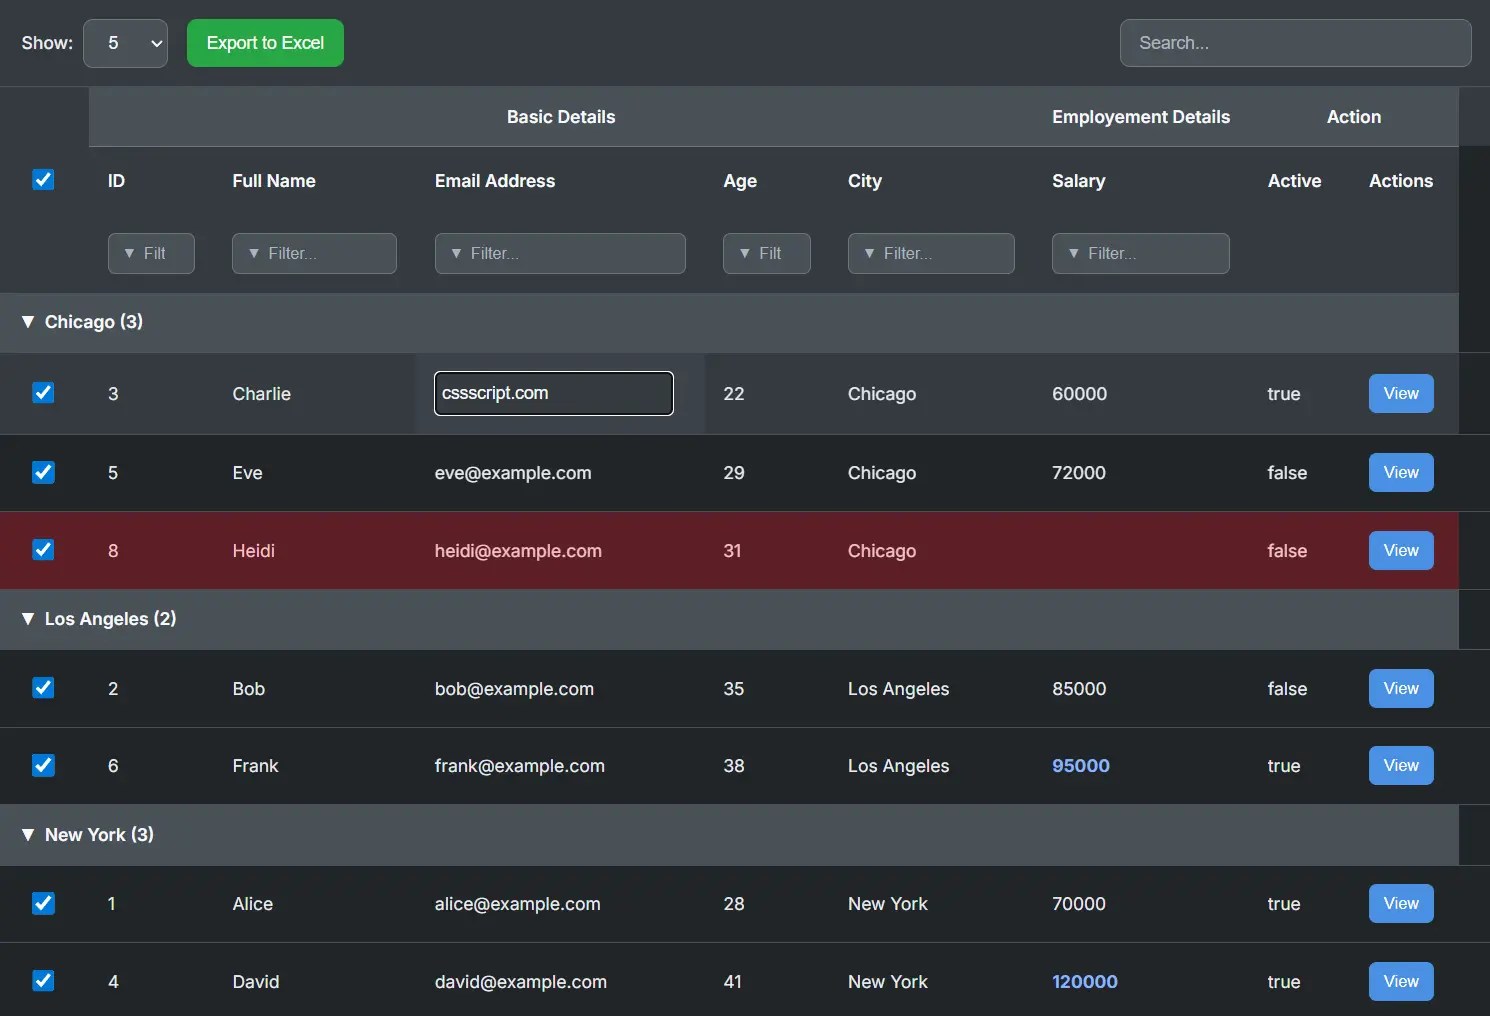
VikCraft Interactive Data Table is a lightweight JavaScript library that creates data tables with advanced features like sorting, filtering, grouping, and inline editing.
Features:
- Client-side and server-side data processing: Handle data locally or fetch from APIs.
- Sorting and filtering: Column header sorting and advanced filtering options.
- Pagination and grouping: Navigate large datasets and group rows by common values.
- Inline editing: Direct cell editing with various input types.
- Row selection: Checkbox support for row selection with select all functionality.
- Excel export: Export filtered and sorted data to Excel files.
- Customizable styling: Built-in themes and custom CSS support.
Use Cases:
- Admin Dashboards: Managing user accounts, orders, or inventory with inline editing and bulk actions for quick data updates.
- Reporting Interfaces: Displaying analytics data with grouping by categories, time periods, or regions with Excel export capabilities.
- Content Management: Handling blog posts, products, or media files with filtering, sorting, and status management features.
- Data Analysis Tools: Exploring datasets with dynamic grouping, custom filtering, and real-time data manipulation for insights.
How to use it:
1. Load the VikCraft Interactive Data Table’s JavaScript and CSS files in your document.
<link rel="stylesheet" href="vikcraft-data-table.css">
<script src="vikcraft-data-table.js"></script>
2. Load the Sheetjs’ library for Excel export.
<script src="/path/to/cdn/xlsx.full.min.js"></script>
3. Create a container for your data table.
<div id="my-advanced-table" class="content-wrapper"></div>
4. Create your data table instance with a data array and column definitions:
data: An array of JavaScript objects used for client-side table rendering.columns: The required array of column definition objects that configure headers, data keys, and features like sorting and filtering.columnGroups: Defines multi-level headers above the standard column labels.actions: An array of objects that define custom action buttons (e.g., ‘View’, ‘Delete’) for each row.enableCheckboxes: A boolean to show or hide the row selection checkboxes.enableSearch: A boolean to enable the global search input field.enableColumnFilter: A boolean to enable individual filter inputs below each column header.enablePagination: A boolean to turn pagination on or off.enablePageLength: A boolean to show the “Show X entries” dropdown for changing page size.enableColumnResize: A boolean that allows users to resize columns by dragging the headers.enableGrouping: A boolean to enable the drag-and-drop row grouping functionality.enableEditing: A boolean to globally enable or disable the inline cell editing feature.enableExcelExport: A boolean to show the “Export to Excel” button.defaultPageLength: Sets the initial number of rows to display per page.pageLengthOptions: An array of numbers that populates the “Show X entries” dropdown.defaultGroupBy: The key of a column to group the data by on initial load.theme: Sets the initial visual theme for the table (‘default’, ‘dark’, or ‘narrow’).serverSide: A boolean that switches the table to server-side processing mode.ajax: The URL endpoint for fetching data whenserverSideis true.method: The HTTP method (‘GET’ or ‘POST’) for the server-sideajaxrequest.customFilters: An object of extra key-value pairs to send with every server-side request.onCheckboxChange: A callback function that executes when a single row’s checkbox is changed.onSelectAll: A callback function that executes when the “select all” checkbox is changed.onCellEdit: A callback function that fires after a cell’s value is changed through inline editing.onRowCreate: A callback that runs for each row upon creation, allowing for custom row styling.excelExportConfig: An object to configure the title, subtitle, and filename for the Excel export.
const myData = [
  { id: 1, name: 'Alice', email: '[email protected]', age: 28, city: 'New York', salary: 70000, active: true },
  { id: 2, name: 'Bob', email: '[email protected]', age: 35, city: 'Los Angeles', salary: 85000, active: false },
  { id: 3, name: 'Charlie', email: '[email protected]', age: 22, city: 'Chicago', salary: 60000, active: true },
  { id: 4, name: 'David', email: '[email protected]', age: 41, city: 'New York', salary: 120000, active: true },
  { id: 5, name: 'Eve', email: '[email protected]', age: 29, city: 'Chicago', salary: 72000, active: false },
  { id: 6, name: 'Frank', email: '[email protected]', age: 38, city: 'Los Angeles', salary: 95000, active: true },
  { id: 7, name: 'Grace', email: '[email protected]', age: 25, city: 'New York', salary: 68000, active: true },
  { id: 8, name: 'Heidi', email: '[email protected]', age: 31, city: 'Chicago', salary: null, active: false },
];
const tableConfiguration = {
  data: myData,
  columns: [
    // IMPORTANT: Define the 'type' for advanced filtering
    { key: 'id', label: 'ID', sortable: true, filterable: true, width: '80px', type: 'number' },
    { key: 'name', label: 'Full Name', sortable: true, filterable: true, editable:true, editType:'text', width: '150px', type: 'string' },
    { key: 'email', label: 'Email Address', sortable: true, filterable: true, editable:true, editType:'text', width: '220px', type: 'string' },
    { key: 'age', label: 'Age', sortable: true, filterable: true, editable:true, editType:'number', width: '80px', type: 'number' },
    { key: 'city', label: 'City', sortable: true, filterable: true, editable:true, editType:'dropdown', editOptions:['New York','Los Angeles','Chicago'], width: '150px', type: 'string' },
    {
      key: 'salary',
      label: 'Salary',
      sortable: true,
      filterable: true,
      width: '120px',
      type: 'number',
      editable:true, editType:'number',
      cellStyler: function(cellValue, rowData) {
        if (cellValue > 85000) {
          // Return a class name to be added to the <td>
          return { className: 'high-experience' };
        }
      }
    },
    { key:'active',label:'Active', sortable:true, filterable:false, editable:true, editType:'checkbox' },
  ],
  // --- TOGGLE FEATURES HERE ---
  enableCheckboxes: true,
  enableSearch: true,
  enableColumnFilter: true,
  enablePagination: true,
  enablePageLength: true,
  enableColumnResize: true,
  enableGrouping: true,
  enableEditing: true,
  enableExcelExport: true,
  excelExportConfig: {
    title: 'Employee Report',
    subtitle: `Generated on: ${new Date().toLocaleDateString()}`,
    filename: 'employee_data_export.xlsx'
  },
  actions: [
    {
      label: 'View',
      className: 'btn-edit',
      onClick: (row) => alert(`Viewing user: ${row.name}`)
    }
  ],
  // Configuration for default features
  defaultPageLength: 5,
  pageLengthOptions: [5, 10, 15, 20],
  columnGroups: [
    { label: 'Basic Details', colspan: 5 },
    { label: 'Employement Details', colspan: 1 },
    { label: 'Action', colspan: 2 },
  ],
  defaultGroupBy: 'city', // Default grouping
  theme: 'dark', // Default theme
  // --- CORRECTED Checkbox Function ---
  // Define the action for the "Select All" checkbox
  onSelectAll: function(isChecked, allSelectedRows) {
    console.clear();
    if (isChecked) {
      console.log(`${allSelectedRows.length} rows have been selected.`);
      // Example: Get all selected employee codes
      const selectedCodes = allSelectedRows.map(row => row.name);
      console.log("Selected Emp Names:", selectedCodes);
      // You can now perform a bulk action, e.g., show a "Delete All" button.
      } else {
        console.log('All rows have been deselected.');
      }
  },
  // Your existing onCheckboxChange for single rows
  onCheckboxChange: function(isChecked, rowData, selectedRows) {
    console.clear();
    console.log(`Row with Emp Name ${rowData.name} was ${isChecked ? 'checked' : 'unchecked'}.`);
    if (selectedRows.length > 0) {
      console.log('Currently selected Emp Name:', selectedRows.map(row => row.name));
    } else {
      console.log('No rows are currently selected.');
    }
  },
  // dd onRowCreate for row-level styling
  onRowCreate: function(rowData, tr) {
    // Example: If employee is not active, give the whole row a light red background
    if (rowData.salary === null) {
      tr.classList.add('row-inactive');
    }
  },
  // fire this whenever any cell is changed
  onCellEdit: (colKey, newVal, row) => {
    console.log(`Edited ${colKey}→`, newVal, 'in row', row);
    // e.g. send PATCH to your server here…
  },
};
// Create a new instance of the data table
const myTable = new VikCraftDataTable('#my-advanced-table', tableConfiguration);
5. You can also fetch tabular data from an external data source:
const tableConfiguration = {
  serverSide: true,
  ajax: 'http://localhost:8000/api/employees/', // Your server endpoint
  method: 'POST', // Can be 'GET' or 'POST'
  customFilters: {
    // Example of custom filters you might send to the server
    status_id: 'Active',
    total_experience: 10,
    csrfmiddlewaretoken: '8Qg9jcdIZBYTeN8UyeqGjN8tHdiqjERTtbRIRZW9UmfxL5rCkEidXDTI9Caeu27x',
  },
  // more options here
};
Your server should return JSON in this format:
{
  "data": [
    // Array of row objects or grouped data structure
  ],
  "recordsTotal": 1000,        // Total records before filtering
  "recordsFiltered": 250,      // Records after filtering
  "isGrouped": false           // Whether data is grouped
}
6. API methods.
setTheme(themeName): Dynamically changes the table’s visual theme.themeNamecan be ‘default’, ‘dark’, or ‘narrow’.getSelectedRows(): Returns an array containing the data objects for all currently selected (checked) rows.reloadData(newFilters = {}): Triggers a full data reload. In server-side mode, it refetches from theajaxURL and resets pagination to the first page. You can optionally pass an object to update thecustomFiltersbefore the request.
FAQs:
Q: How do I handle large datasets without performance issues?
A: Use server-side mode for datasets over 1000 rows. Set serverSide: true and implement the required API endpoint. This moves filtering, sorting, and pagination processing to your backend, keeping the browser responsive regardless of total data size.
Q: Can I customize the styling beyond the built-in themes?
A: Absolutely. All styles are namespaced under .vikcraft-data-table-wrapper, so you can override any CSS without conflicts. Use the cellStyler function for dynamic cell styling and the onRowCreate callback for row-level customizations.
Q: Does the Excel export include filtered data only?
A: Yes, the Excel export respects current filters, sorting, and grouping. It exports exactly what the user sees in the table, not the entire dataset. You can customize the export filename, title, and subtitle through the excelExportConfig option.
Q: How do I validate edited cell values before saving?
A: The onCellEdit callback receives the new value before it’s applied. You can perform validation logic there and potentially reject changes by not updating your data source. For server-side validation, make your API call within this callback and handle errors appropriately.
Q: Can I add custom buttons or actions to each row?
A: Yes, use the actions configuration array to define custom buttons. Each action object includes a label, CSS class, and onClick function that receives the row data. The library automatically adds these buttons to each row with your specified styling.
Q: How do I format data in a column, like a date or currency?
A: The library doesn’t have a built-in formatter function in the column definition. The expected way to handle this is to pre-format the data before you pass it to the table. For example, create a new property in your data objects like formattedSalary: '$' + item.salary and point the column key to formattedSalary.
Q: How can I implement a custom filter, like a date range picker?
A: The built-in column filters are for basic text and number inputs. For something more complex, you would build your date picker UI outside the table. When the date range changes, you call the myTable.reloadData({ startDate: '...', endDate: '...' }) method. Those values get merged into the customFilters object and sent to your server with the next data request. This only works in server-side mode.
Related Reading:
See Also:
 Modern Data Table Library for Web Developers – TablixJS
 High Performance Table Data Presentation Library – regular-table
 Lightweight Vanilla JS Data Grid for Modern Web Apps – BWDataTable
 Advanced Data Grid/Table Library in Vanilla JavaScript – VanillaGrid
 Build Searchable Data Views from JSON Data with SenangWebs Index
 Vanilla JavaScript Table Enhancement: Search, Sort, Paginate
 Flexible Interactive Data Table In Pure JavaScript – JSTable
 Full-featured Interactive Data Table JavaScript Library – simple-datatables