


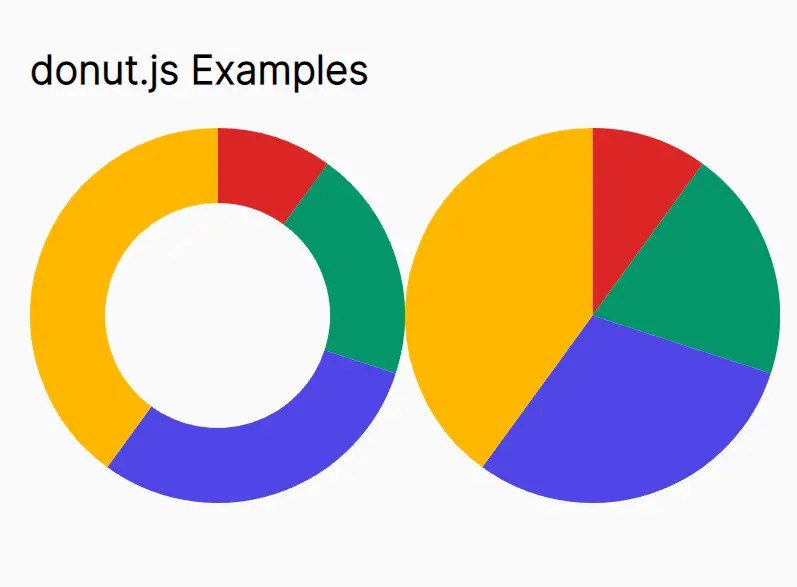
donut.js is a tiny JavaScript library for generating SVG donut/pie/ring charts to present data in an engaging way, including portfolio allocations, budget breakdowns, sales data, performance metrics, customer demographics, and more.
How to use it:
1. Download and insert the donut.js into the document.
<script src="donut.js"></script>
2. Create an empty container to hold the chart.
<div id="example"></div>
3. Initialize the donut.js and define your data in a JS array as follows:
const myDonut = donut({
      el: document.getElementById('example'),
      data: [{
          value: 1,
          name: 'A'
      }, {
          value: 2,
          name: 'B',
          customData: 'CSSScript'
      }, {
          value: 3,
          name: 'C'
      }
      // ...
      ],
});
4. To create a pie chart, just set the weight value to half of the size value.
const myDonut = donut({
      el: document.getElementById('example'),
      data: [{
          value: 1,
          name: 'A'
      }, {
          value: 2,
          name: 'B',
          customData: 'CSSScript'
      }, {
          value: 3,
          name: 'C'
      }
      // ...
      ],
      size: 150,
      weight: 75,
});
5. Customize the colors for the slices.
const myDonut = donut({
      el: document.getElementById('example'),
      data: [{
          value: 1,
          name: 'A'
      }, {
          value: 2,
          name: 'B',
          customData: 'CSSScript'
      }, {
          value: 3,
          name: 'C'
      }
      // ...
      ],
      colors: ['#000', '#333', '#666']
});
6. API methods.
const slice = document.getElementById('example').querySelector('[data-name="3"]');
// set color
myDonut.setColor(slice, '#8dc700');
// set/get data
myDonut.data(slice[, data])
See Also:
 Lightweight Responsive SVG Charts with CSS Transitions – Beaned-Charts
 Lightweight Pie/Donut Charts with CSS Conic Gradients – Pietry
 Minimal Pie & Ring (Donut) Chart JavaScript Library – Charty
 Animated Pie/Donut/Ring Chart With Canvas And JavaScript – rpie.js
 High-Performance WebGPU Charting Library for Large Datasets – ChartGPU
 Basic Pie Chart In Pure JavaScript – ChartJS
 Minimal Bar/Line/Pie Chart JavaScript Library – Chartly.js
 Single Element Pie Chart (Circle Diagram) With CSS