


Pietry is a lightweight and dependency-free JavaScript library that generates customizable pie and ring(donut) charts using CSS conic gradients. No SVG & Canvas required.
Features
- Dual Chart Modes: Create full pie charts or ring charts by toggling the contentHTML option.
- Flexible Sizing: Configure chart dimensions using any CSS measurement unit (px, rem, em, vh, vw).
- Color Customization: Define custom colors for each data segment with standard hex, RGB, or named color values.
Use Cases
- Admin Dashboards: Display server status or user distribution statistics quickly.
- Budget Trackers: Visualize expense categories in personal finance applications.
- Portfolio Skills: Show proficiency levels in various technologies using ring charts.
- Progress Indicators: Create circular progress bars for task completion rates.
How To Use This Pie Chart Library:
1. Download the library files and load them in your HTML document:
<link rel="stylesheet" href="pietry.css">
<script src="./pietry.js"></script>
2. Create the container elements for your pie chart:
<!-- Main chart container with unique ID -->
<div id="chart-example">
  <!-- Border element that displays the conic gradient -->
  <div class="pietry-chart-border">
    <!-- Content area for ring charts or center labels -->
    <div class="pietry-chart-content"></div>
  </div>
</div>
<!-- Breakdown list container -->
<div id="chart-breakdown" class="chart-breakdown"></div>
<!-- Template for breakdown items (hidden by default) -->
<div class="chart-item" id="tmpl-chart-item" style="display: none;">
  <div class="chart-item-indicator"></div>
  <div class="chart-item-name"></div>
</div>
3. Define your chart segments as an array of objects:
const data = [
  {
    name: "Feature Development",
    percentage: 45,
    color: "#4CAF50", // Green
  },
  {
    name: "Bug Fixes",
    percentage: 20,
    color: "#F44336", // Red
  },
  {
    name: "Refactoring",
    percentage: 15,
    color: "#2196F3", // Blue
  },
  {
    name: "Code Review & Planning",
    percentage: 10,
    color: "#FFEB3B", // Yellow
  },
  {
    name: "Documentation",
    percentage: 10,
    color: "#9C27B0", // Purple
  },
];
4. Initialize Pietry with your configuration object.
const chart = new Pietry({
   color: "black",  // Not currently used in rendering
   borderWidth: 16,  // Width of the chart ring in measurement units
   size: 108,  // Total chart diameter
   contentBackgroundColor: "white",  // Background color of center area
   measurementUnit: "px",  // CSS unit for size values
   list: data,  // Your data array
   element: "chart-example",  // Container element ID (without #)
   contentHTML: "CSSScript.com"  // Optional: converts to ring chart with center content
});
5. Render the chart to the DOM:
chart.display();
6. Pietry handles the chart visualization. It does not automatically generate a legend. You can use this helper function to render the breakdown based on the HTML template you just created.
const render = {
  chartItems(data, element) {
    let el = document.querySelector(element);
    if (el) {
      for (let item of data) {
        // Clone the hidden template element
        let tmpl = document.getElementById("tmpl-chart-item").cloneNode(true);
        tmpl.removeAttribute("id");
        tmpl.style.display = "flex";
        // Set the color indicator background
        tmpl.querySelector(".chart-item-indicator").style.backgroundColor = item.color;
        // Set the item name and percentage text
        tmpl.querySelector(".chart-item-name").innerText = `${item.name} (${item.percentage}%)`;
        el.appendChild(tmpl);
      }
    }
  }
};
// Render breakdown items into the container
render.chartItems(data, "#chart-breakdown");
Alternatives:
FAQs
Q: Can I animate the chart when percentages change?
A: The library does not include built-in animation support. CSS conic gradients cannot be animated through CSS transitions because gradient values are not interpolatable properties.
Q: How do I handle data that doesn’t sum to 100%?
A: The library renders whatever percentages you provide without validation. If your data sums to less than 100%, the remaining portion will display as empty space using the contentBackgroundColor. If the sum exceeds 100%, segments will overlap and only the last-defined colors will be visible in the overlapping regions.
Q: Can I add click handlers to individual chart segments?
A: The current implementation renders the entire chart as a single gradient background. Individual segments are not separate DOM elements, so you cannot attach click handlers directly to them.
Q: Does the library support responsive sizing?
A: Yes, you can use relative CSS units like rem, em, vh, or vw by setting the measurementUnit option. The chart will scale with its container when using these units.
See Also:
 Lightweight Responsive SVG Charts with CSS Transitions – Beaned-Charts
 Minimal SVG Donut/Pie Chart Generator – donut.js
 Minimal Pie & Ring (Donut) Chart JavaScript Library – Charty
 Animated Pie/Donut/Ring Chart With Canvas And JavaScript – rpie.js
 High-Performance WebGPU Charting Library for Large Datasets – ChartGPU
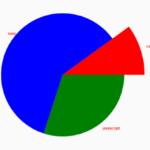 Basic Pie Chart In Pure JavaScript – ChartJS
 Minimal Bar/Line/Pie Chart JavaScript Library – Chartly.js
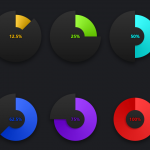 Single Element Pie Chart (Circle Diagram) With CSS