


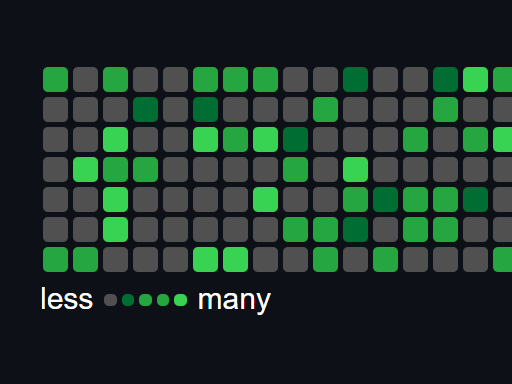
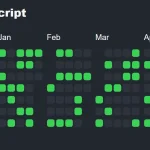
Heatmap.js is a JavaScript library to generate a Github contribution graph like heatmap for displaying user activity.
See Also:
- jQuery Plugin For github Style Heatmap Calendar – Contribution Graph
- Github Style Calendar Heatmap In jQuery
- Github Style Heatmap Graph Plugin With jQuery – Calmosaic
How to use it:
1. Load the JavaScript Heatmap.js and CSS Heatmap.css in the document.
<script src="heatmap.js"></script>
<link rel="stylesheet" href="heatmap.css" />
2. Create a container to hold the heatmap.
<div id="heatmap"></div>
3. Prepare your data in a JS object.
{
  1.4.2021T0:0:0: 4,
  1.6.2021T0:0:0: 4,
  1.8.2021T0:0:0: 1,
  1.9.2021T0:0:0: 1,
  2.1.2021T0:0:0: 2,
  // ...
}
4. Render the heatmap with the given data.
let heatmap = new HeatmapPlugin('heatmap', data);5. Customize the heatmap.
let heatmap = new HeatmapPlugin('heatmap', data, {
    legend: true,
    timescale: true,
    range: {
        from: '#year#-01-01T00:00:00',
        till: '#year#-12-30T00:00:00',
        grade: 1,
        interval: 'day', //month, year, hours, minutes
        rows: 7,
    },
    units: 5
});
6. Override the default styles of the heatmap.
let heatmap = new HeatmapPlugin('heatmap',data, {
    legend: true,
    timescale: true,
    range: {
        from: '#year#-01-01T00:00:00',
        till: '#year#-12-30T00:00:00',
        grade: 1,
        interval: 'day', //month, year, hours, minutes
        rows: 7,
    },
    units: 5
},{
    width: '10',
    height: '10',
    font: {
      size: '10',
      family: 'Arial',
      color: 'white'
    }
});
7. Determine whether to render the heatmap instantly.
let heatmap = new HeatmapPlugin('heatmap',data, {
    legend: true,
    timescale: true,
    range: {
        from: '#year#-01-01T00:00:00',
        till: '#year#-12-30T00:00:00',
        grade: 1,
        interval: 'day', //month, year, hours, minutes
        rows: 7,
    },
    units: 5
},{
    width: '10',
    height: '10',
    font: {
      size: '10',
      family: 'Arial',
      color: 'white'
    }
}, true);
See Also:
 Generate Customizable Heat Maps For Date-based Activities – Heat.js
 Simple Heat Map Generator with JavaScript and Canvas – Simpleheat
 Customizable And Extensible Calendar Heatmap Library – cal-heatmap
 Easy Calendar Heatmap Web Component – contributions-calendar.js
 Create A Scroll Position Heat Map using JS and Canvas – ViewHeatmap.js
 JavaScript Library For Performant Scrollable Table – Smart Table Scroll
 Create Interactive Charts With Zooming And Panning Features – SenCharts
 Easily Convert and Validate Naming Conventions with Convconv