


CSS only bar and scatter plot graphs with graceful fallback support for mobile devices.
How to use it:
Load the cssgraph_bar.css for the bar graph, and cssgraph_plot.css for the plot graph.
<link rel="stylesheet" href="cssgraph_bar.css">
<link rel="stylesheet" href="cssgraph_plot.css">
Create HTML tables for the bar and scatter plot graphs.
<table id="bar-graph">
<caption>Web Performance Results</caption>
<thead>
  <tr>
      <th></th>
      <th class="before">Before</th>
      <th class="after">After</th>
  </tr>
</thead>
<tbody>
  <tr id="section-1">
      <th scope="row">Initial Load Time</th>
      <td class="before bar"><p>4.7s</p></td>
      <td class="after bar"><p>1.1s</p></td>
  </tr>
  <tr id="section-2">
      <th scope="row">Visually Complete</th>
      <td class="before bar"><p>3.1s</p></td>
      <td class="after bar"><p>1.5s</p></td>
  </tr>
  <tr id="section-3">
      <th scope="row">Fully Loaded</th>
      <td class="before bar"><p>4.8s</p></td>
      <td class="after bar"><p>1.4s</p></td>
  </tr>
</tbody>
</table>
<div id="bar-ticks">
  <div class="tick"><p>5.0s</p></div>
  <div class="tick"><p>4.0s</p></div>
  <div class="tick"><p>3.0s</p></div>
  <div class="tick"><p>2.0s</p></div>
  <div class="tick"><p>1.0s</p></div>
  <div class="tick"><p>0.0s</p></div>
</div>
<!-- Plot Graph -->
<h2 class="title">Scatter Plot Graph</h2>
<table id="dot-plot-graph">
  <caption>Make vs Avg. Mileage</caption>
  <tbody>
      <tr id="section-1" class="section">
          <th scope="row">honda</th>
          <td class="dot"><p>25.2km</p></td>
      </tr>
      <tr id="section-2" class="section">
          <th scope="row">hyundai</th>
          <td class="dot"><p>21.1km</p></td>
      </tr>
      <tr id="section-3" class="section">
          <th scope="row">audi</th>
          <td class="dot"><p>17.3km</p></td>
      </tr>
      <tr id="section-4" class="section">
          <th scope="row">pontiac</th>
          <td class="dot"><p>16.2km</p></td>
      </tr>
      <tr id="section-5" class="section">
          <th scope="row">jeep</th>
          <td class="dot"><p>14.3km</p></td>
      </tr>
      <tr id="section-6" class="section">
          <th scope="row">dodge</th>
          <td class="dot"><p>10.1km</p></td>
      </tr>
  </tbody>
</table>
<div id="plot-ticks">
  <div class="tick"><p>15</p></div>
  <div class="tick"><p>20</p></div>
  <div class="tick"><p>25</p></div>
</div>
Previews:
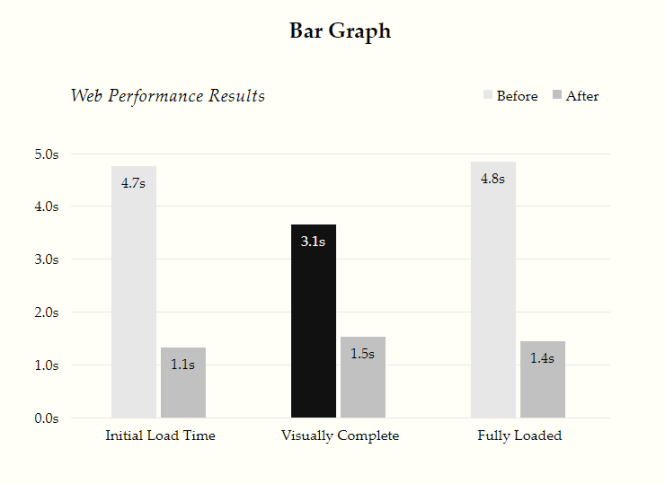
Bar Graph (Desktop)

Scatter Plot Graph Desktop
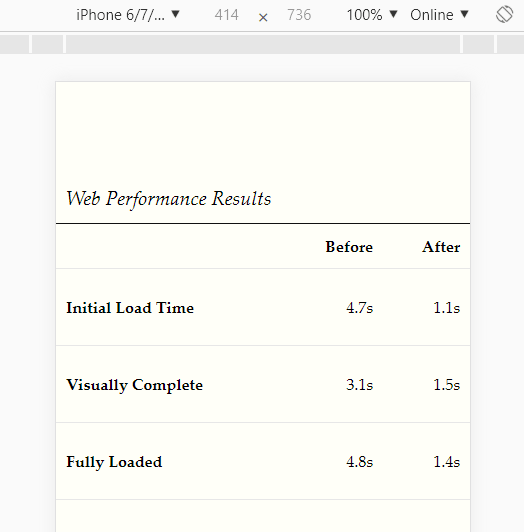
Bar Graph (Mobile)
See Also:
 High-Performance WebGPU Charting Library for Large Datasets – ChartGPU
 Lightweight Responsive SVG Charts with CSS Transitions – Beaned-Charts
 Financial Data Visualization Library for JavaScript – VisionCharts
 Minimalist Bar (Column) Charts with HTML5 Canvas – bar-js
 Minimal Bar/Line/Pie Chart JavaScript Library – Chartly.js
 Horizontal/Vertical Time Series Bar Chart In Vanilla JavaScript – horizontalcharts.js
 Segmented Horizontal Bar Graph Library – liner-bar.js
 Animated Column/Line/Area/Pie Chart Library – Graph.js