


Chartie is a lightweight canvas-based charting library that enables you to create interactive data visualizations for modern web apps where performance and bundle size matter.
Features:
- Six chart types: Bar, line, pie, doughnut, area, and scatter plots
- Ultra-lightweight: Complete library under 10kb bundled
- Canvas-based rendering: Direct GPU acceleration with pure Canvas API
- Smooth animations: Built-in easing functions with configurable durations
- Responsive design: Automatic scaling and retina display support
- TypeScript support: Full type definitions included
- Zero dependencies: No external libraries required
How to use it:
1. Install Chartie via npm.
npm install chartie
2. Place a canvas element in your HTML with a unique ID.
<canvas id="example"></canvas>
3. Import Chartie and create a new instance. The constructor takes the canvas element’s ID and a configuration object.
import { Chartie } from 'chartie';// Define the chart's data and options
const config = {
type: 'bar',
data: {
labels: ['Jan', 'Feb', 'Mar'],
datasets: [{
label: 'Sales',
data: [12, 19, 3],
backgroundColor: '#3b82f6'
}]
}
};// Create the chart
const chart = new Chartie('example', config);4. Chart types and configurations:
// bar chart
const config = {
type: 'bar',
data: {
labels: ['Jan', 'Feb', 'Mar'],
datasets: [{
label: 'Sales',
data: [12, 19, 3],
backgroundColor: '#3b82f6'
}]
}
};
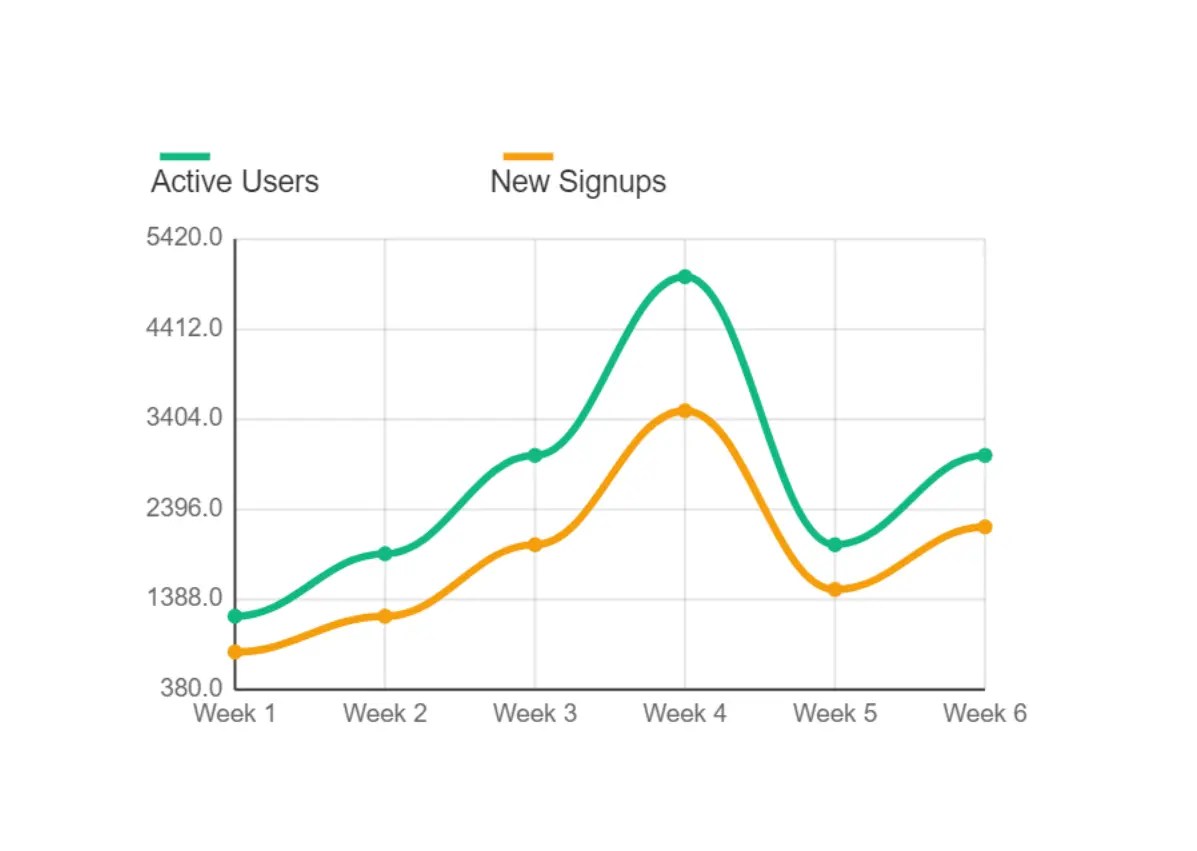
// line chart
const config = {
"type": "line",
"data": {
"labels": [
"Week 1",
"Week 2",
"Week 3",
"Week 4",
"Week 5",
"Week 6"
],
"datasets": [
{
"label": "Active Users",
"data": [
1200,
1900,
3000,
5000,
2000,
3000
],
"borderColor": "#10b981",
"backgroundColor": "rgba(16, 185, 129, 0.1)",
"borderWidth": 3,
"fill": false,
"tension": 0.4
},
{
"label": "New Signups",
"data": [
800,
1200,
2000,
3500,
1500,
2200
],
"borderColor": "#f59e0b",
"backgroundColor": "rgba(245, 158, 11, 0.1)",
"borderWidth": 3,
"fill": false,
"tension": 0.4
}
]
},
"options": {
"responsive": true,
"animation": {
"duration": 1000,
"easing": "easeInOut"
}
}
}
// pie chart
const config = {
"type": "pie",
"data": {
"labels": [
"React",
"Vue",
"Angular",
"Svelte",
"Next.js"
],
"datasets": [
{
"data": [
35,
25,
20,
12,
8
],
"backgroundColor": [
"#6366f1",
"#10b981",
"#f59e0b",
"#ef4444",
"#8b5cf6"
]
}
]
},
"options": {
"animation": {
"duration": 1500,
"easing": "easeInOut"
}
}
}
// donut chart
const config = {
"type": "doughnut",
"data": {
"labels": [
"Desktop",
"Mobile",
"Tablet"
],
"datasets": [
{
"data": [
60,
35,
5
],
"backgroundColor": [
"#06b6d4",
"#10b981",
"#f59e0b"
]
}
]
},
"options": {
"animation": {
"duration": 1300,
"easing": "easeInOut"
}
}
}
// area chart
const config = {
"type": "area",
"data": {
"labels": [
"Q1",
"Q2",
"Q3",
"Q4"
],
"datasets": [
{
"label": "Sales Growth",
"data": [
100,
150,
300,
250
],
"borderColor": "#8b5cf6",
"backgroundColor": "rgba(139, 92, 246, 0.2)",
"borderWidth": 2,
"tension": 0.3
}
]
},
"options": {
"animation": {
"duration": 1100,
"easing": "easeInOut"
}
}
}
// scatter chart
const config = {
"type": "scatter",
"data": {
"datasets": [
{
"label": "Dataset 1",
"data": [
{
"x": 10,
"y": 20
},
{
"x": 15,
"y": 25
},
{
"x": 20,
"y": 22
},
{
"x": 25,
"y": 28
},
{
"x": 30,
"y": 35
},
{
"x": 35,
"y": 32
}
],
"backgroundColor": "#ef4444"
},
{
"label": "Dataset 2",
"data": [
{
"x": 12,
"y": 15
},
{
"x": 18,
"y": 20
},
{
"x": 22,
"y": 18
},
{
"x": 28,
"y": 25
},
{
"x": 32,
"y": 30
},
{
"x": 38,
"y": 28
}
],
"backgroundColor": "#06b6d4"
}
]
},
"options": {
"animation": {
"duration": 900,
"easing": "easeInOut"
}
}
}5. React integration. You’ll want to use a ref to access the canvas element and useEffect to manage the chart’s lifecycle. This is important because you need to clean up the chart instance when the component unmounts.
import { useEffect, useRef } from 'react';
import { Chartie } from 'chartie';
function LineChartComponent() {
  const canvasRef = useRef(null);
  useEffect(() => {
    // canvasRef.current is the <canvas> element
    const chart = new Chartie(canvasRef.current, {
      type: 'line',
      data: {
        labels: ['Mon', 'Tue', 'Wed', 'Thu'],
        datasets: [{
          label: 'Revenue',
          data: [65, 59, 80, 81],
          borderColor: '#ef4444',
          tension: 0.4 // Creates a nice curve
        }]
      }
    });
    // Cleanup function to run when the component unmounts
    return () => chart.destroy();
  }, []); // Empty dependency array runs this effect once
  return <canvas ref={canvasRef}></canvas>;
}
6. All possible configuration options:
// Core chart types
export type ChartType = 'bar' | 'line' | 'pie' | 'doughnut' | 'area' | 'scatter';
// Color types
export type Color = string | CanvasGradient | CanvasPattern;
// Data point types
export interface DataPoint {
  x: number;
  y: number;
  label?: string;
}
export interface Dataset {
  label?: string;
  data: number[] | DataPoint[];
  backgroundColor?: Color | Color[];
  borderColor?: Color;
  borderWidth?: number;
  fill?: boolean;
  tension?: number; // for line charts
}
// Chart configuration
export interface ChartConfig {
  type: ChartType;
  data: {
    labels?: string[];
    datasets: Dataset[];
  };
  options?: ChartOptions;
}
export interface ChartOptions {
  responsive?: boolean;
  maintainAspectRatio?: boolean;
  backgroundColor?: Color;

  // Animation
  animation?: {
    duration?: number;
    easing?: 'linear' | 'easeInOut' | 'easeIn' | 'easeOut';
  };

  // Scales (for bar, line, area, scatter charts)
  scales?: {
    x?: AxisConfig;
    y?: AxisConfig;
  };

  // Legend
  legend?: {
    display?: boolean;
    position?: 'top' | 'bottom' | 'left' | 'right';
    labels?: {
      color?: Color;
      font?: {
        size?: number;
        family?: string;
      };
    };
  };

  // Tooltip
  tooltip?: {
    enabled?: boolean;
    backgroundColor?: Color;
    titleColor?: Color;
    bodyColor?: Color;
    borderColor?: Color;
    borderWidth?: number;
  };

  // Padding
  padding?: {
    top?: number;
    right?: number;
    bottom?: number;
    left?: number;
  };
}
export interface AxisConfig {
  display?: boolean;
  min?: number;
  max?: number;
  grid?: {
    display?: boolean;
    color?: Color;
    lineWidth?: number;
  };
  ticks?: {
    display?: boolean;
    color?: Color;
    font?: {
      size?: number;
      family?: string;
    };
  };
}
// Internal chart bounds and dimensions
export interface ChartBounds {
  x: number;
  y: number;
  width: number;
  height: number;
}
// Animation frame interface
export interface AnimationFrame {
  progress: number;
  currentValues: Record<string, number>;
}
See Also:
 Easy Performant JavaScript Animation Engine – Motionia
 Pure CSS/CSS3 Based Image Slider
 Scroll Position Based Animations In JavaScript – Trigger.js
 Easy Timer/Countdown/Chronometer Library – easytimer.js
 Convenient Analog Clock With JavaScript And SVG – Uptime
 Simple Interactive Gantt Chart Creator
 Create Custom Scrollbars With Pure JavaScript – scrollBot
 Pure CSS / CSS3 Fullscreen Hamburger Menu