


DiagJS is a simple-to-use JavaScript library that lets you dynamically draw an animated, interactive pie chart on an HTML5 canvas element.
How to use it:
Create an empty canvas element on which you want to draw the pie chart.
<canvas width="800" height="800" id="example">
  Sorry, canvas not supported
</canvas>
Download and insert the diagjs.js script into the web page.
<script src="diagjs.js">
Define the data (percentage values and color codes) in the JavaScript.
var elements = {
    dogs: 0.3,
    cats: 0.6,
    dinosaurs: 0.1
};
var colors = {
    dogs: 'green',
    cats: 'blue',
    dinosaurs: 'red'
};
Draw the pie chart on the canvas element and done.
var canvas = document.getElementById('can');
var diag = diagJS.PieChart(elements, colors, canvas);
diag.draw();
See Also:
 High-Performance WebGPU Charting Library for Large Datasets – ChartGPU
 Lightweight Responsive SVG Charts with CSS Transitions – Beaned-Charts
 Lightweight Pie/Donut Charts with CSS Conic Gradients – Pietry
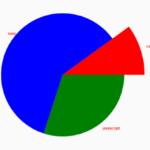 Basic Pie Chart In Pure JavaScript – ChartJS
 Minimal Bar/Line/Pie Chart JavaScript Library – Chartly.js
 Minimal SVG Donut/Pie Chart Generator – donut.js
 Single Element Pie Chart (Circle Diagram) With CSS
 Minimal Pie & Ring (Donut) Chart JavaScript Library – Charty