


rbar.js is a tiny JavaScript bar chart plugin to render animated, highly customizable column chart with labels & scales using plain JavaScript and HTML5 canvas.
How to use it:
1. Import the rbar.js library into the document.
<script src="rbar.js"></script>
2. Create an HTML canvas on which you want to draw the column chart.
<canvas id="myCanvas">
</canvas>
3. Define your data in an array of JS objects containing key/value pairs.
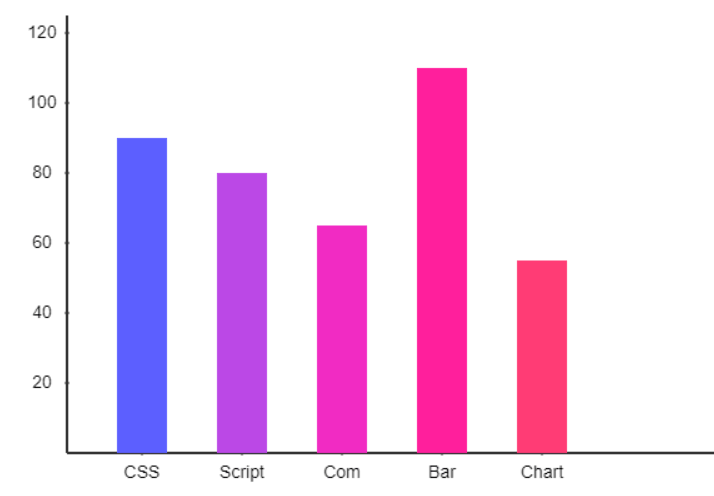
var data = [
    {'Product 1': 90},
    {'Product 2': 80},
    {'Product 3': 65},
    {'Product 4': 110},
    {'Product 5': 55}
];
4. Set the background color for each column as follows. OPTIONAL.
var barcolor = ['#5c5fff', '#bb48e6', '#f12bc3', ...];
5. Render a basic column chart on the canvas element. That’s it.
generateBarGraph({
  barId: 'myCanvas',
  barData: data,
  barColour: barcolor
});
6. Full options to customize the column chart.
generateBarGraph({
  // canvas ID
  barId: 'rbar',
  // chart data
  barData: data,
  // background color
  barColour: '#020202',
  // stroke width
  barStroke: 50,
  // space between columns
  barSpaces: 80,
  // column padding
  barInnerPadding: 80,
  // X-Axis division position from left side of the bar chart
  barDivisionPositionFromLineX: 20,
  // Y-Axis division position from bottom side of the bar chart
  barDivisionPositionFromLineY: 20,
  // enable animation
  barAnimation: true,
  // animation speed
  barAnimationSpeed: 1,
  // font property
  barTextFont: "14px Arial",
  // division to the Y-Axis
  barDivision: 5,
  // scale division marking to the X-Axis
  barScaleDivisionReqX: true,
  // scale division marking to the Y-Axis
  barScaleDivisionReqY: true,
  // manually setup the Y-Axis division upto the highest value of your array
  barScaleDivisionY: null
  // stroke of scale division
  barScaleDivisionStroke: 1,
  // stroke colour of the scale division
  barScaleDivisionColour: '#333',
  // stroke of the X & Y-Axis line
  barAxisLineStroke: 1,
  // stroke colour of the X & Y-axis line
  barAxisLineColour: '#333',
  // max height in pixels
  barMaxHeight: 120

});
See Also:
 Financial Data Visualization Library for JavaScript – VisionCharts
 Minimalist Bar (Column) Charts with HTML5 Canvas – bar-js
 Animated Column/Line/Area/Pie Chart Library – Graph.js
 Minimal Canvas Based Bar & Line Chart Library – TChart.js
 Simple Plain Column Chart JavaScript Library – simpleBar.js
 Flexbox Bar & Column Charts In Pure CSS
 Animated Bar & Column Chart With D3.js – animated-bars
 Minimal Bar/Columns Chart With JavaScript And Canvas – bar-js