تفصیل
Power Charts allows you to create highly responsive, flexible charts & graphs for your WordPress site. Choose from an array of configurable chart types.
All charts and graphs are created using the powerful D3.js library.
Click here for plugin support.
If you have a moment, consider leaving feedback in the comments section. This is really important and helps us continuously improve upon the plugin. Help us to make it even better!
Please also rate the plugin if you find it useful.
Thanks for your continued support! 🙂
David – wpgoplugins.com
اسکرین شاٹس
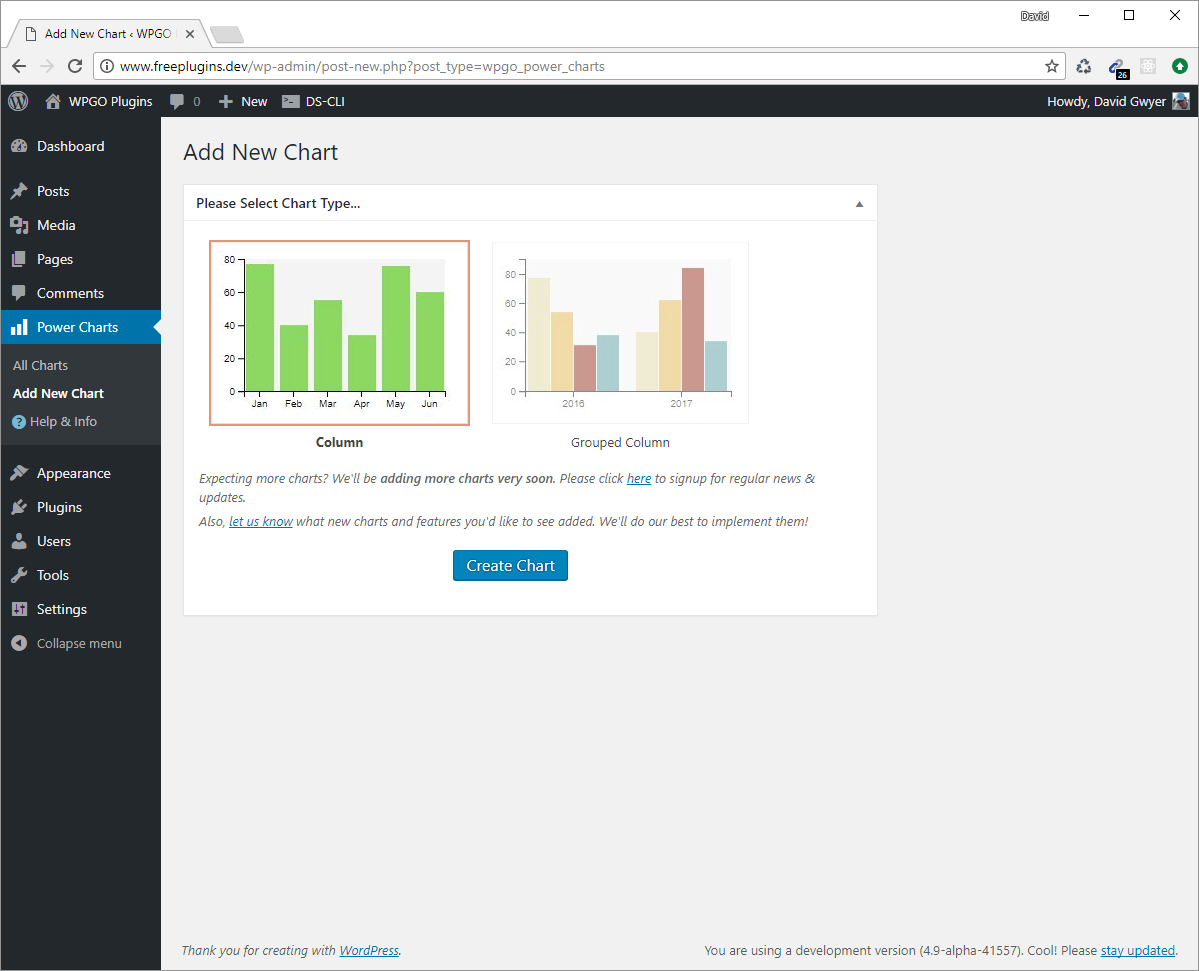
Choose your chart type. 
Configure chart settings, and see the chart preview update in real-time! 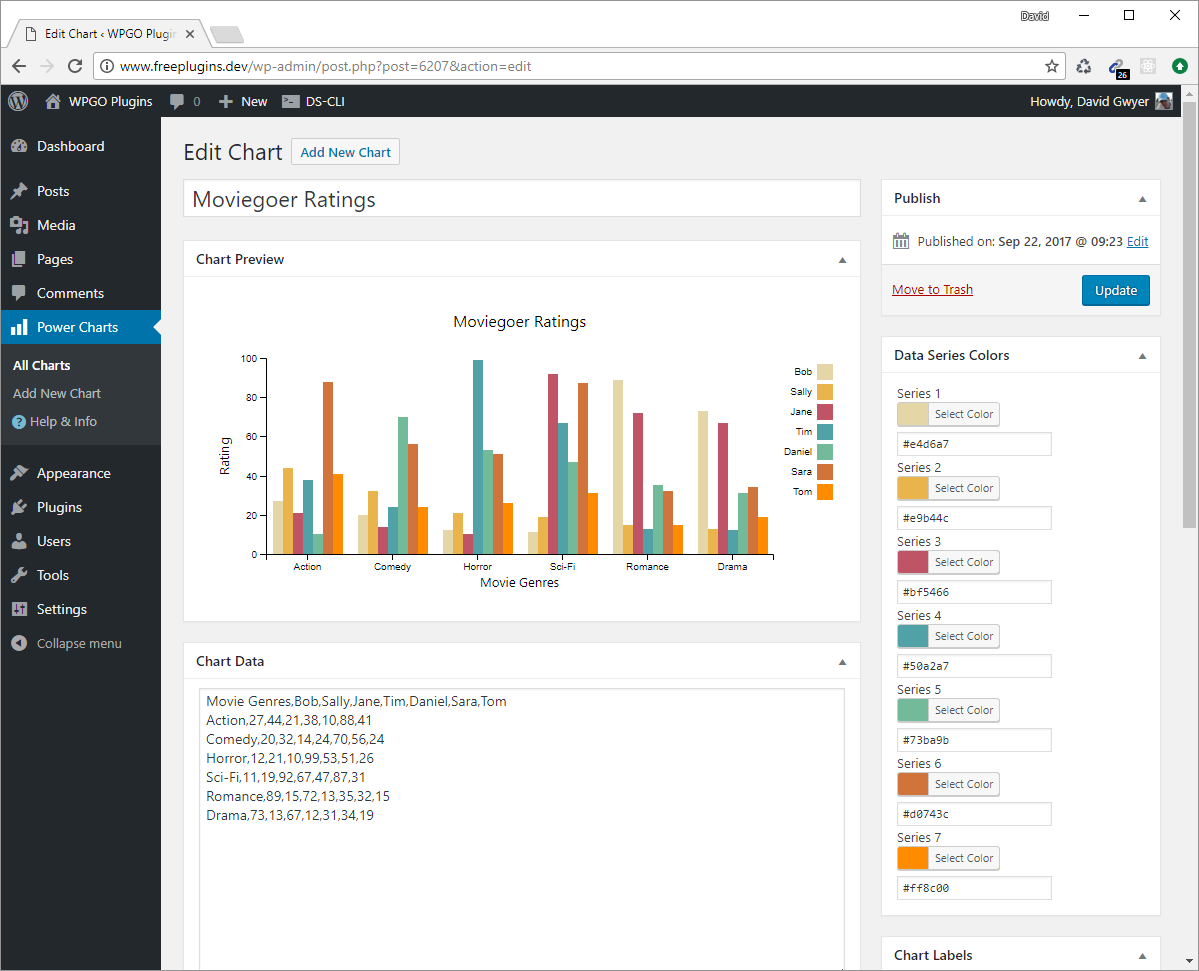
Change chart colors easily. 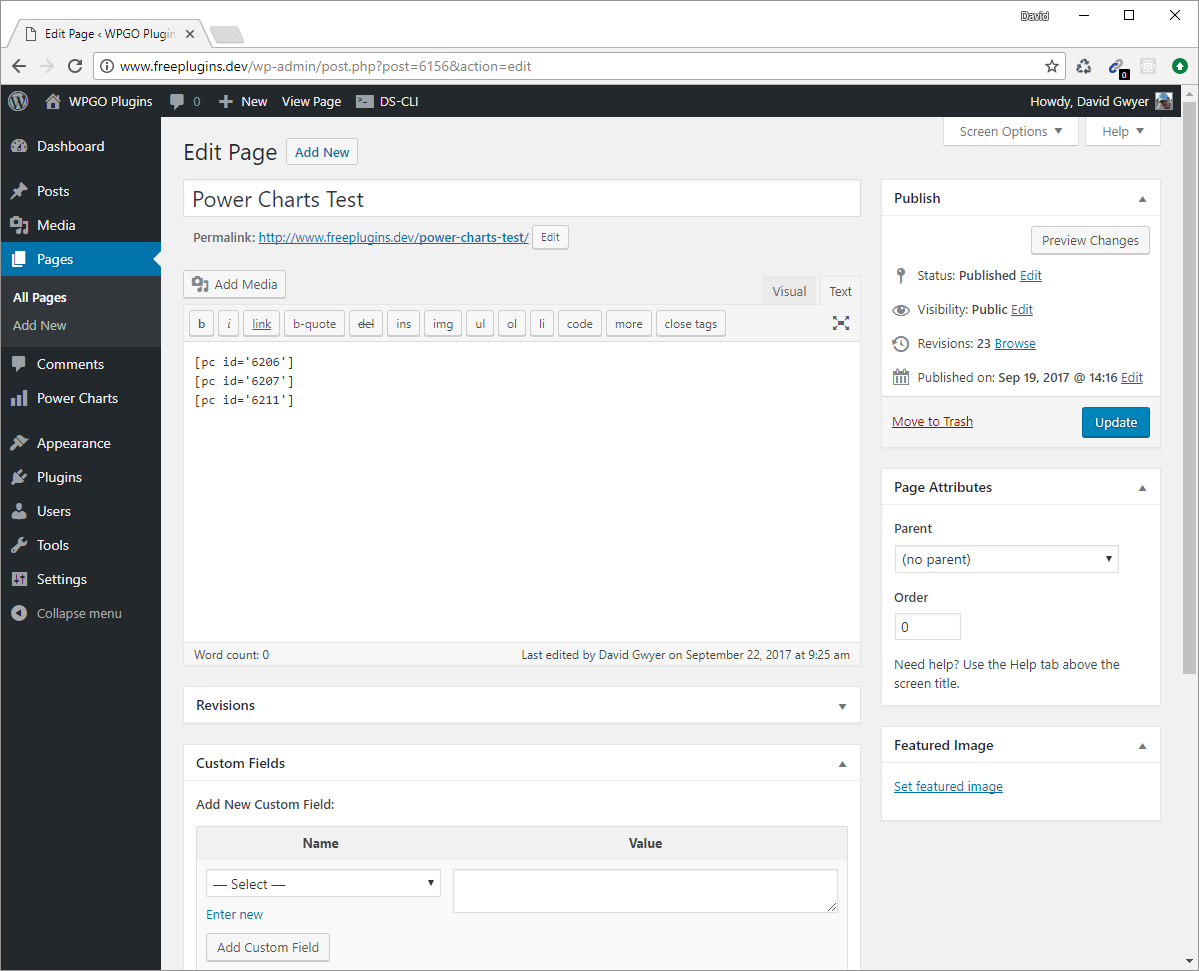
Add the chart shortcode(s) to any WordPress page, post, or text widget. 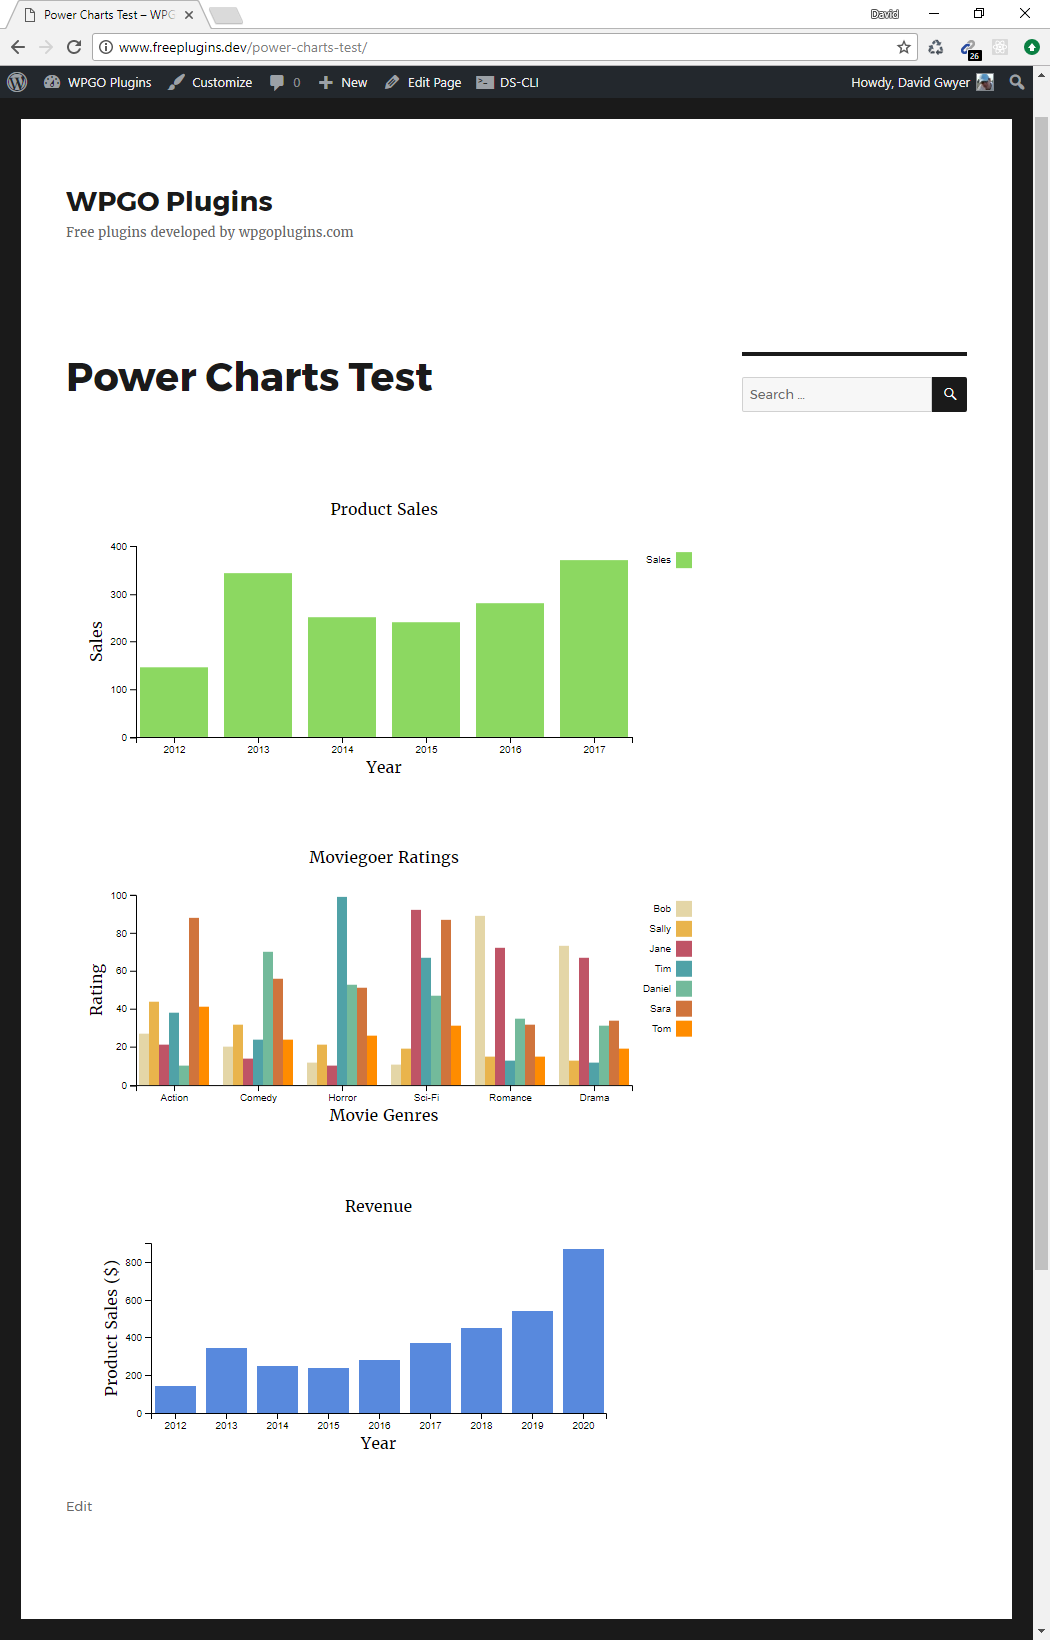
View your chart(s) on the front end of your site. 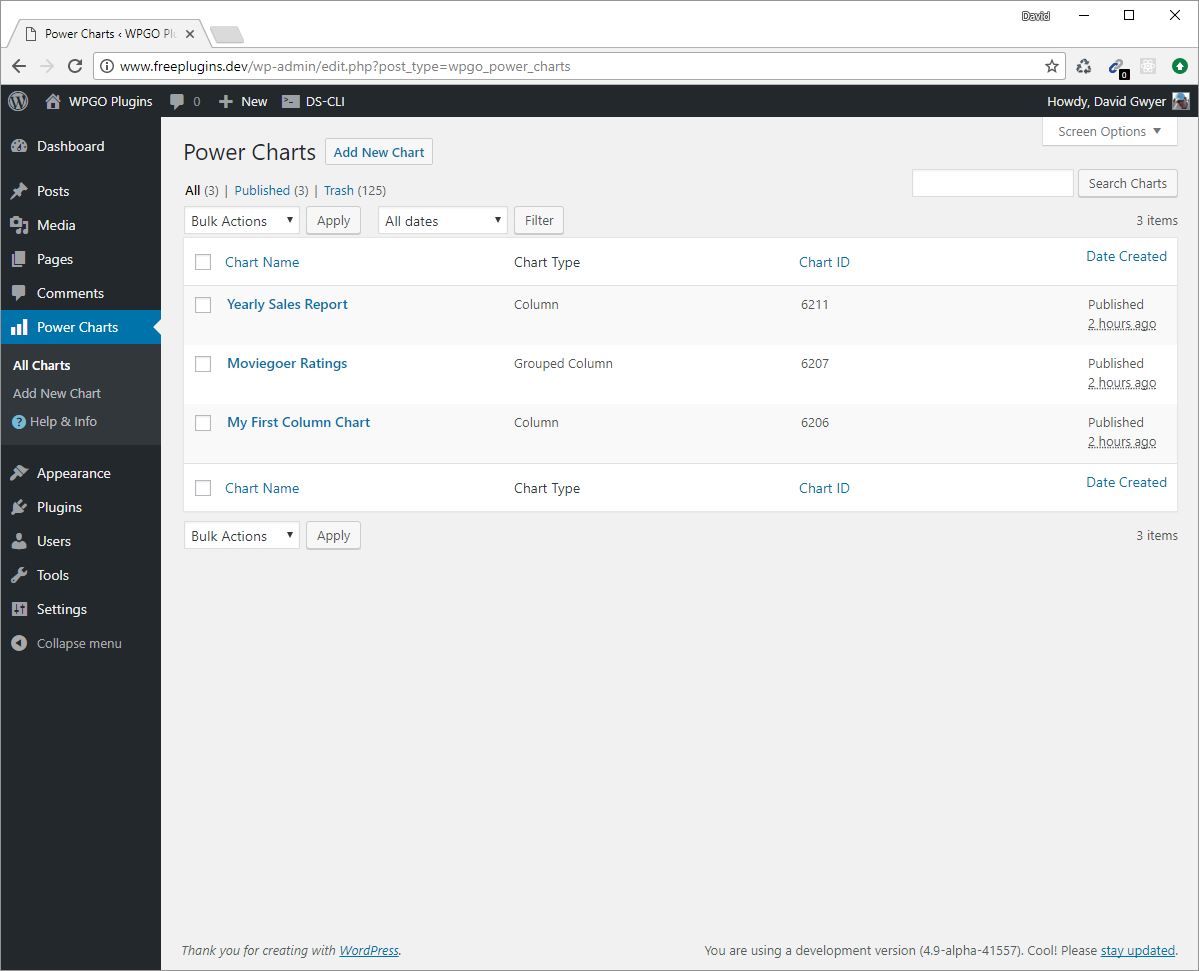
Easily manage your charts via the chart list page.
انسٹالیشن
- Via the WordPress admin go to Plugins => Add New.
- Enter ‘Power Charts’ (without quotes) in the text box and click the ‘Search Plugins’ button.
- In the list of relevant Plugins click the ‘Install’ link for Power Charts on the right hand side of the page.
- Click the ‘Install Now’ button on the popup page.
- Click ‘Activate Plugin’ to finish installation.
- Under the main Power Charts menu click ‘Add New Chart’.
- Select your desired chart type and click ‘Create Chart’.
- Use the [pc id=”123″] shortcode in a page, post, or text widget to display a chart. Replace ‘123’ with the specific ID of the chart you want to display.
عمومی سوالات
- Installation Instructions
-
- Via the WordPress admin go to Plugins => Add New.
- Enter ‘Power Charts’ (without quotes) in the text box and click the ‘Search Plugins’ button.
- In the list of relevant Plugins click the ‘Install’ link for Power Charts on the right hand side of the page.
- Click the ‘Install Now’ button on the popup page.
- Click ‘Activate Plugin’ to finish installation.
- Under the main Power Charts menu click ‘Add New Chart’.
- Select your desired chart type and click ‘Create Chart’.
- Use the [pc id=”123″] shortcode in a page, post, or text widget to display a chart. Replace ‘123’ with the specific ID of the chart you want to display.
جائزے
There are no reviews for this plugin.
شراکت دار اور ڈیویلپرز
“Power Charts – Responsive Beautiful Charts & Graphs” اوپن سورس سافٹ ویئر ہے۔ مندرجہ ذیل لوگوں نے اس پلگ ان میں حصہ لیا:
شراکت دار“Power Charts – Responsive Beautiful Charts & Graphs” کا اپنی زبان میں ترجمہ کریں۔
ڈویلپمینٹ میں دلچسپی ہے؟
کوڈ براؤز کریں، ایس این وی ریپوزیٹری کو چیک کریں یا ڈویلپمینٹ لاگ کو سبسکرائب کریں بذریعہ آر ایس ایس۔
چینج لاگ
0.1.0, SEPTEMBER 27th – 2017
- Initial plugin release! This version is a proof of concept release.