Platform
Centralized Tags Management (Feb 23)
Tags Management is a major step towards a unified management experience throughout the ControlUp platform. It provides a centralized location to manage tags (key-value pairs), which you can then use to organize and manage your resources.
For this initial release, Tags Management is integrated only with Synthetic Monitoring. We intend to expand this feature throughout more areas of the platform. All existing tags (previously called labels) created in Synthetic Monitoring have been automatically migrated to the new Tags Management area.
Active session timeout (Feb 9)
To improve security, we’ve introduced an Active Session Timeout to set the absolute maximum duration for a session in ControlUp’s web console. This duration is customizable (default: 24 hours).
Note that this new setting is in addition to the existing Idle Session Timeout. You can also bypass all timeouts for a specific user with the TV Mode permission (useful for displaying dashboards on a TV for 24/7 monitoring).
License usage over time report (Feb 9)
You can now track your historical license usage for ControlUp products, including a PDF export to share with stakeholders. Access the new report under Settings > Subscription. This feature is initially available only for individual organizations. Support for MSP tenant managers is not included in this release.
.png)
ControlUp for Desktops
Enrich browser extension version 2.0.16 (Feb 12)
Improved device detection and reduced browser impact: Improved search performance for quicker device matching across orgs with a lot of devices. Device searches now run even more efficiently in the background, keeping browsers responsive.
ControlUp for Apps
Granular extension deployment options (Feb 23)
We’re giving you more control over how you deploy the ControlUp for Apps browser extension in your environment. You can now:
Target specific browsers: Choose which browsers receive the extension to prevent unnecessary installations.
Create multiple deployment rules: Use device groups and tags to customize deployments for different sets of devices. For example, you can target specific departments, or exclude certain groups from receiving the extension.
New Employees view for App Groups (Feb 23)
We’ve added a new Employees view to let you focus on the individual employees using your apps. This view helps you identify:
Who is using the app: See a detailed list of employees, their devices, and usage metrics, with a direct drill down to their employee page.
Where they are: See where employees using the app are located.
Key health metrics: See score breakdown per-domain, total usage metrics, and unused license cost.
ControlUp for VDI
Join the 9.2 beta version! See details in the Latest VDI Version release notes.
For previous versions, see ControlUp for VDI (Real-Time DX versions).
Go to the Download Center to get this latest build for the Real-Time DX Console and Agents.
Need help? Contact your support representative.
Synthetic Monitoring
We continuously release Cloud and Custom hives. To keep your hives and scouts updated, be sure to use the latest and see what we released here:
Cloud and Custom Hive Release Notes.
Centralized Scout tag management (Feb 23)
You now create tags (previously called labels) for your Scouts in our new centralized tags management area. All your existing Scout labels have been automatically migrated to the new tags management area.
Workflows
Workflows REST API (Feb 23)
Workflows can now be managed programatically using Public REST APIs. You can:
View, disable, update, or delete your flows
List and delete forms
List and delete integrations

Skip Failed Nodes (Feb 19)
If a specific node in your flow fails, you can now enable the flow to ignore the error and continue running. To ignore errors, click the Ignore error toggle in the node details to ignore errors.
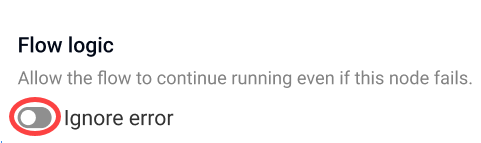
Now, if an error occurs while the node performs an action, the flow will ignore the error and continue to run:

Datadog Integration (Feb 19)
Workflows now integrates with Datadog. Use this integration to incorporate monitoring and observability actions into your flows. New Datadog action nodes allow you to:
Create incidents
Schedule downtime
Send logs
Send performance metrics
Manage metadata tags
Submit events
Run History Enhancements (Feb 19)
The enhanced Run history page now:
Displays the trigger of each run
Displays error messages for failed nodes
Loads faster

Debug with AI (Feb 4)
If your flow run fails, you can now debug with AI to quickly understand what went wrong. The new AI Summary highlights the exact node that failed and explains the issue clearly. Click Explain with AI to get guided steps to debug the issue and successfully rerun your flow.

Usability Enhancements (Feb 4)
We’ve added several user experience improvements across Workflows to make building, managing, and running flows smoother and more intuitive.