
The Solid Security Logs area provides you an exhaustive view of security (or security-adjacent) activities on your WordPress site, giving you the ability to monitor and investigate potential security threats effectively. The logs help you identify patterns, such as repeated login attempts or recognize vulnerabilities discovered by the Solid Security Site Scanner.
You can configure various logging settings by navigating to Security -> Settings -> Global Settings.
Solid Security offers two logging methods, each with pros and cons:
- Database Only: Stores the logs in your database, making them easy to access but potentially slowing down your site if they grow too large. The default number of days the logs are stored is 60 days.
- File Only: Store the logs in your filesystem, making it potentially faster, but the plugin doesn’t process them, meaning you’ll hae to download and examine them manually. The default number of days the logs will be stored with this setting is 180 days.
Database Only logging is the correct choice for nearly all users, unless your site has high traffic and you find the logs to be bloating your database. No matter what, you can always change this setting later.
Reviewing log details #
For every log entry, you can see critical information such as the module the log is for (for examples: Site Scan or Brute Force), type of event, description, timestamp, and the associated IP address or user.
Select “View Details” on a log entry, to see important details of the entry as well as the option to view the raw details.
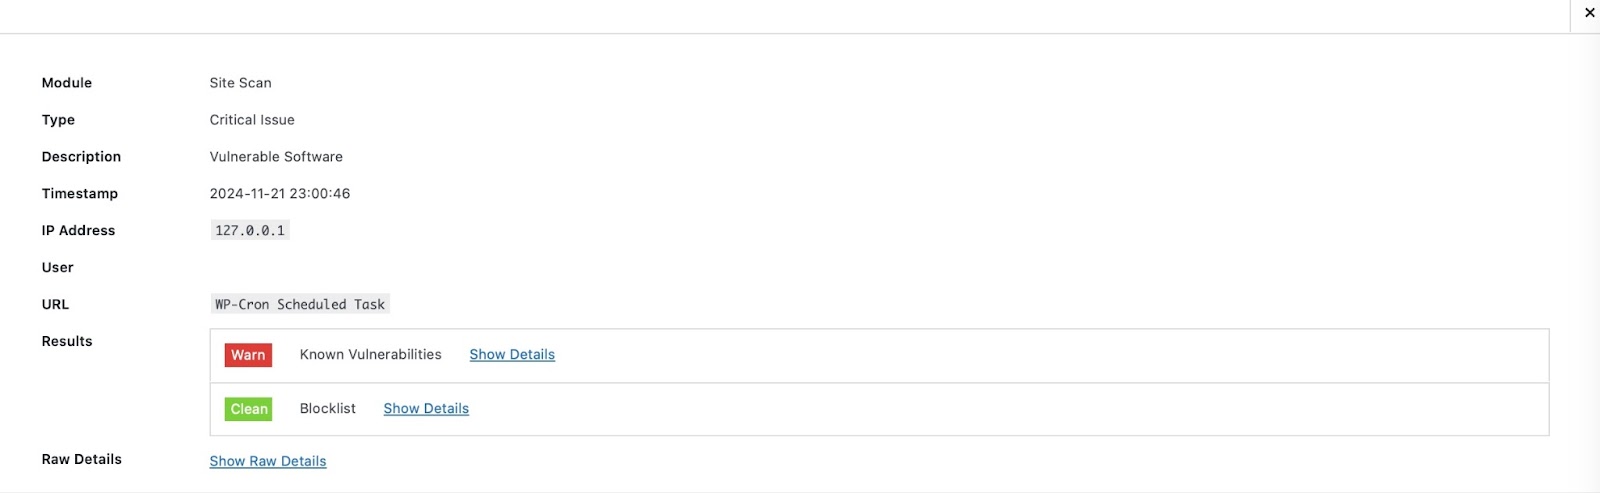
Selecting “Show Raw Details” gives you a comprehensive look at the data captured during the activity. This is valuable when you want to get a detailed insight of specific events for troubleshooting and/or debugging purposes.
The key data that you can see on the raw details area are:
- Module: Specifies which module generated the log entry
- Type and Code: Identifies the entry’s category (ex. site-scanner, brute_force) and its specific code (ex. Invalid-login, vulnerable-software)
- Timestamp: Shows when the event occurred and when it was processed
- User Information: Includes user details like user ID, username, or associated IP address
- Event Information: Provides additional structured information about the event such as the authentication types used, the found vulnerabilities, or the error messages
- Server Details: Displays relevant server information such as request headers, referred data, or server settings

In the example screenshot, a login attempt was made into the site and the attacker tried to log in via the /wp-login.php page using the username “red”, which is not a registered username.
There is nothing alarming in this example when viewed in isolation, but if it’s part of a pattern or if the attempt had used a registered username it becomes a more significant concern. You could use the log’s raw data alongside other information to decide to
- Enable Two-Factor Authentication
- Enforcing Strong Passwords on administrator accounts
- Creating a new admin account for the compromised admin username
- Regular monitoring of login attempts
- Adding CAPTCHA to the login form
Logs give you information to knowledgeably take proactive measures to mitigate the security risks on your site.
User Logging #
The “User Logging” module of Solid Security Pro logs the following user actions:
- Login/Logout
- Content update
- Plugin activation, deactivation, install and delete
- User creation and deletion
- User Registration
But before you can see it on your Security Logs page, you need to take a few extra steps to activate it.
First, go to Security -> Settings -> Features -> Site Check and turn ON the User Logging module:

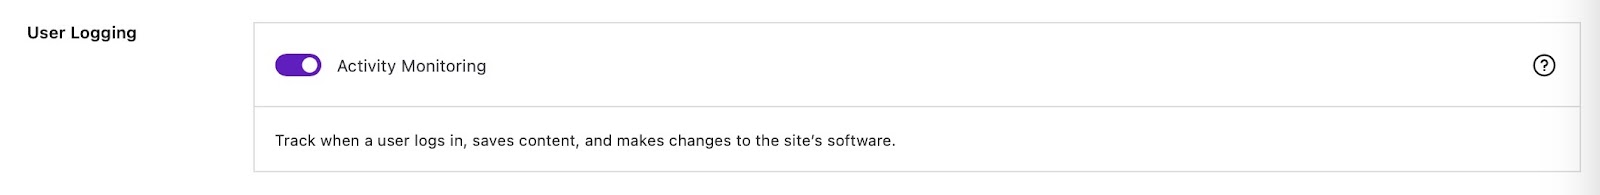
Next, go to the User Groups settings and activate the “Activity Monitoring” setting on your preferred user group:
To view the User Logging logs, head to Security -> Logs and filter “User Logging” under the “All Events” tab:

Using Filters and Screen Options #
Within the Security Logs page, you can utilize the Filters and Screen Options settings for a more focused analysis of the log events.
The Filters tabs include: Important Events, All Events, Critical Issues, Error, Warnings, Actions, and Notices.
The Critical Issues, for example, flags high-priority concerns like detected vulnerabilities, so that you can address them promptly. The Errors logs, on the other hand, logs down the site issues encountered by Solid Security such as failure to send emails or run scans.
By default, you will see the Important Events filter first when navigating to the Security Logs page. To change this behavior, you can open the Screen Options settings located at the top-right corner of the page:

Aside from changing the “View Mode”, you can also use the Screen Options settings to customize the Security Logs display according to your preferences.
The Debug and Process advanced entries will display logs related to the plugin operations and/or system process. While both can be useful for troubleshooting, note that they will also increase the size of your logs.
In essence, the Security Logs area gives you valuable, actionable insights to help safeguard your site’s integrity. By monitoring the logs and leveraging its data, you can proactively address potential security threats and ensure a secure environment for both you and your users.
Clearing Security Logs #
Solid Security automatically purges old log entries based on your Logging retention settings. You can configure how many days to keep logs by navigating to: Security > Settings > Global Settings > Logging
If your logs appear not to be clearing as expected, you can use the following methods:
Automatic Log Cleanup #
Solid Security removes logs once they reach your configured retention period. If logs are not being purged, verify that the number of days is set correctly in the Logging section.
Manual Cleanup via Database #
For sites where logs have grown large, you can manually clear the itsec_logs table if you have database access.
You may empty this table through phpMyAdmin or another database management tool.
Using a Third-Party Log Cleaner #
Some users prefer using automated tools to manage older logs. A community-built solution is: Log cleaner for Solid Security (this is not an official SolidWP plugin but is commonly used by customers)
Troubleshooting Log Purging (WP-Cron) #
If logs are not clearing automatically, the scheduled log-purge process may not be running.
- Enable the Solid Security Debug menu (see how to enable Debug Mode).
- Open the Scheduler table and look for the
purge-log-entriestask. - From here you can:
- Manually trigger the task
- Reset all Solid Security scheduled tasks, which can fix stuck entries
If the task appears but does not run, it may indicate an issue with your site’s WP-Cron configuration on the server, which you’ll want to check with your hosting provider.
