Tag Archives: macOS

JamfReports Ruby Gem

Ruby Gem for Jamf Pro API

JamfReports is a ruby gem that uses the Jamf Pro API for hosted instances. Currently, it only reports on Applications. Pulling from the /api/v1/computers-inventory?section=APPLICATIONS endpoint.

For gem install instructions see here

*Future reports may be added.


Usage

In order to run JamfReports, you are required to add these two lines to the top of your file, under the require JamfReports line

#!/usr/bin/ruby
require "JamfReports"

## UPDATE THESE VARIABLES -------------------------------
$jamfpro_url = "https://company.jamfcloud.com" 
$api_pw = "Your API KEY HERE"

If you don’t have your api key for the $api_pw variable, run this command to create it and paste it into the variable.

printf "jamfUserName:JamfPassword" | iconv -t ISO-8859-1 | base64 -i -

And these 3 lines to generate the api token and pull the data from Jamf so you can run the report commands.

JamfReports.getToken
JamfReports.checkTokenExpiration
JamfReports.getAllApplicationInventory

A full working file might look like this.

#!/usr/bin/ruby
require "JamfReports"

## UPDATE THESE VARIABLES ----------------------------------------
$jamfpro_url = "https://company.jamfcloud.com" 
$api_pw = "Your API KEY HERE"

## COMMANDS ------------------------------------------------------
JamfReports.getToken
JamfReports.checkTokenExpiration
JamfReports.getAllApplicationInventory

## REPORTS -------------------------------------------------------
JamfReports.listAllInstalledApps
# JamfReports.webBrowserReport
# JamfReports.totalNumberOfOneInstalledApps
# JamfReports.listofOneInstallApps

## After reporting, revoke current token
JamfReports.invalidateToken

Examples

listAllInstalledApps

Returns a sorted list of all apps installed across your fleet of computers in Jamf. Sorted from most installed app, to least.

webBrowserReport

  • Google Chrome.app
  • Google Chrome Canary.app
  • Firefox.app
  • Firefox Developer Edition.app
  • Safari.app
  • Safari Technology Preview.app
  • Microsoft Edge.app
  • Brave Browser.app
  • Arc.app
  • Opera.app
  • LinCastor Browser.app
  • LockDown Browser.app
  • Tor Browser.app
  • Vivaldi.app
  • DuckDuckGo.app

totalNumberOfOneInstalledApps
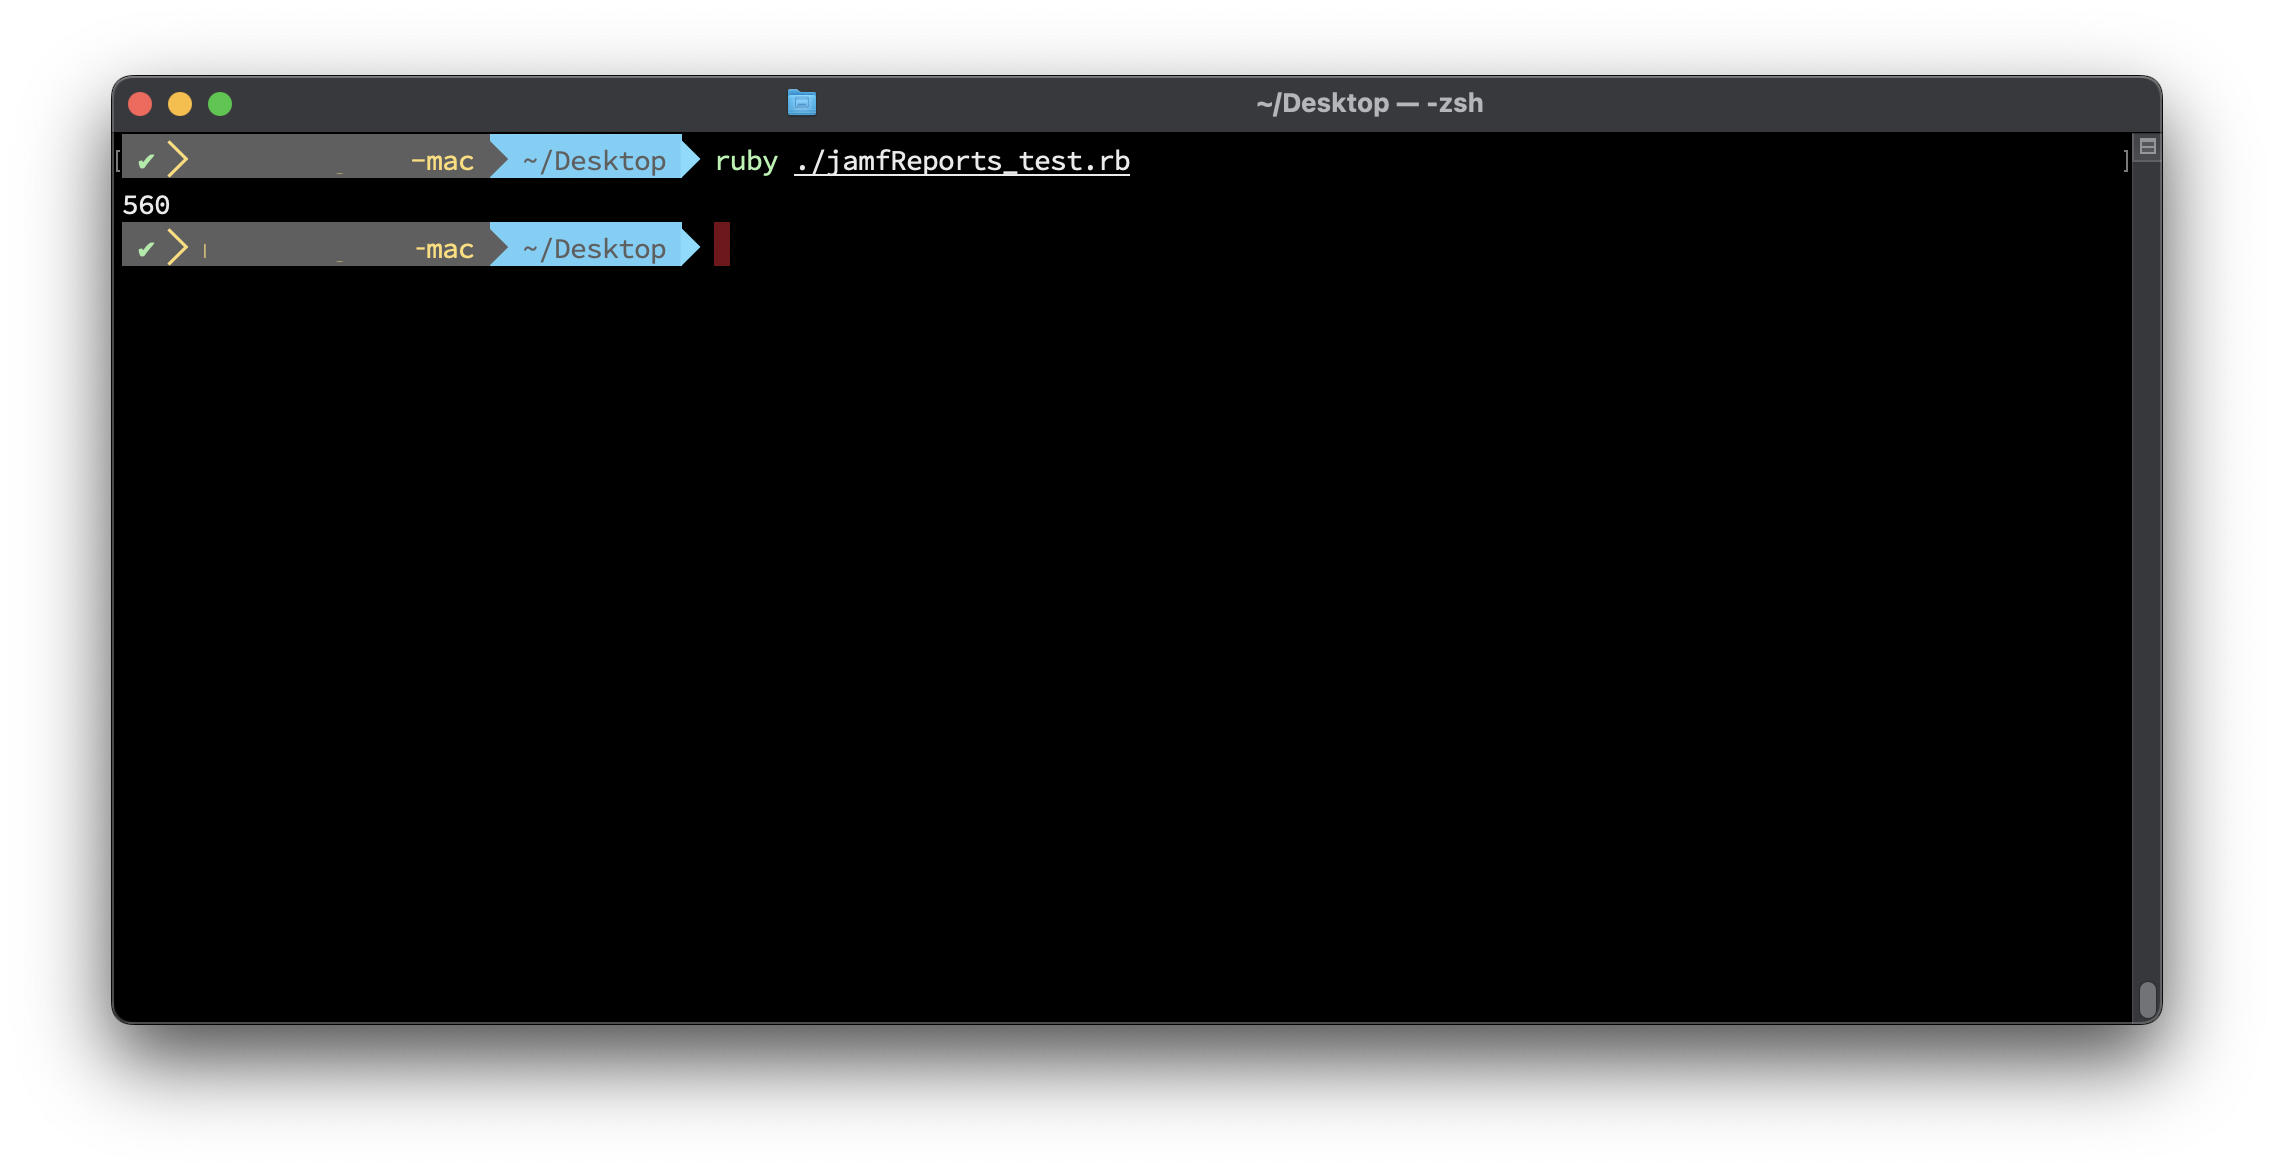
Returns a single metric to show the number of “One-off” or single installed apps across your fleet.

listofOneInstallApps
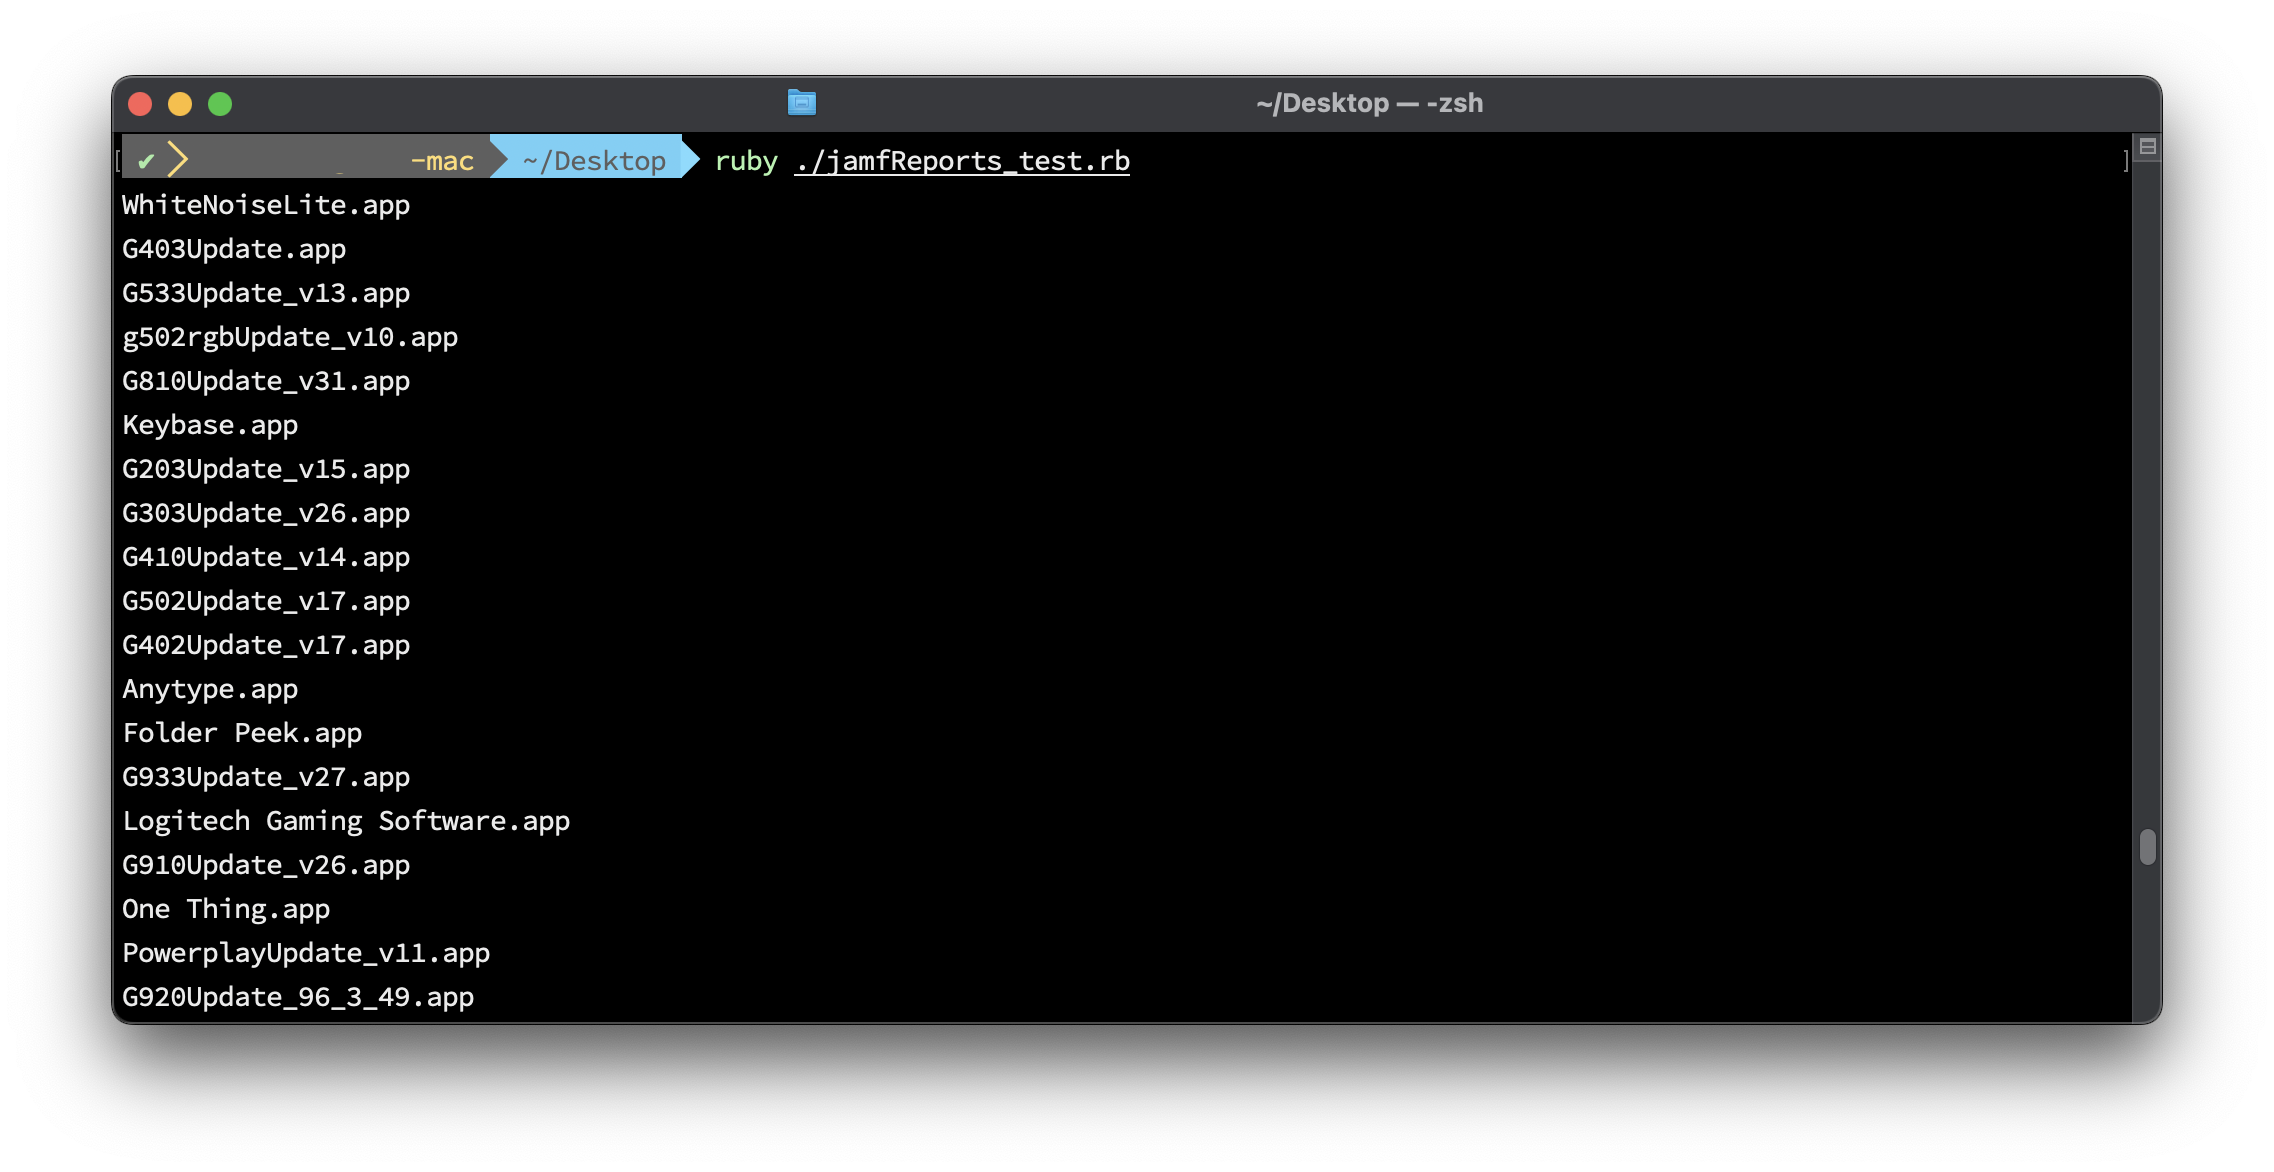
Returns a list of all the “One-off” or single installed apps across your fleet. This can be helpful in scoping in Jamf uninstall policies.

macOS Content Caching Metrics

Content caching is a service in macOS that speeds up downloading of software distributed by Apple and data that users store in iCloud by saving content that local Apple devices have already downloaded. If you’ve enabled it in “System Preferences > Sharing > Content Caching”. You know that it couldn’t be easier to set up. But have you ever wondered, what is content caching doing? Is it even working?

Luckily Apple has provided the AssetCacheManagerUtil command-line tool to manage content caching, with the status option that will output some metrics.

AssetCacheManagerUtil status                                                          
2022-06-19 15:14:20.159 AssetCacheManagerUtil[95604:12021093] Content caching status:
    Activated: true
    Active: true
    ActualCacheUsed: 61.6 GB
    CacheDetails: (4)
        iCloud: 5.62 GB
        iOS Software: 7.54 GB
        Mac Software: 34.31 GB
        Other: 29.13 GB
    CacheFree: 110.83 GB
    CacheLimit: 250 GB
    CacheStatus: OK
    CacheUsed: 76.6 GB
    MaxCachePressureLast1Hour: 0%
    Parents: (none)
    Peers: (none)
    PersonalCacheFree: 110.83 GB
    PersonalCacheLimit: 250 GB
    PersonalCacheUsed: 5.62 GB
    Port: 56183
    PrivateAddresses: (1)
        10.0.1.102
    PublicAddress: xx.xx.xx.xx
    RegistrationStatus: 1
    RestrictedMedia: false
    ServerGUID: D2BE5986-6E42-41AC-845D-27A87C6EE6B6
    StartupStatus: OK
    TetheratorStatus: 0
    TotalBytesAreSince: 2022-05-10 12:10:15
    TotalBytesDropped: 7.3 MB
    TotalBytesImported: 1.72 GB
    TotalBytesReturnedToChildren: Zero KB
    TotalBytesReturnedToClients: 135.66 GB
    TotalBytesReturnedToPeers: Zero KB
    TotalBytesStoredFromOrigin: 59.88 GB
    TotalBytesStoredFromParents: Zero KB
    TotalBytesStoredFromPeers: Zero KB

This is a good start but you might want to know, what does TotalBytesReturnedToClients mean? You can reference all the metrics in Apple’s Developer Docs. Where we can find that TotalBytesReturnedToClients is:

The amount of data, in bytes, that the content cache served to client iOS, macOS, and tvOS devices since the TotalBytesAreSince date.

This is progress. But the AssetCacheManagerUtil tool spits out one large json output. How can I pull individual metrics?

jq is a lightweight and flexible command-line JSON processor that can be easily installed with home-brew.

brew install jq

And with the below command, you can parse the output for a single metric:


AssetCacheManagerUtil status -j 2>/dev/null | jq '.result.TotalBytesReturnedToClients'
135658827669

But now you’ll notice the output isn’t nice and human-readable like it was before we parsed it, jq will return values in bytes. You’ll need to convert it to MB’s or GB’s if you want.

Now that we can use jq , we can pull the metrics we care about:


AssetCacheManagerUtil status -j &>/dev/null | jq '.result.Active'  
AssetCacheManagerUtil status -j &>/dev/null | jq '.result.ActualCacheUsed'  
AssetCacheManagerUtil status -j &>/dev/null | jq '.result.CacheDetails.iCloud' 
AssetCacheManagerUtil status -j &>/dev/null | jq '.result.CacheDetails."iOS Software"'  
AssetCacheManagerUtil status -j &>/dev/null | jq '.result.CacheDetails."Mac Software"'   
AssetCacheManagerUtil status -j &>/dev/null | jq '.result.CacheDetails.Other' 
AssetCacheManagerUtil status -j &>/dev/null | jq '.result.CacheFree' 
AssetCacheManagerUtil status -j &>/dev/null | jq '.result.CacheUsed'  
AssetCacheManagerUtil status -j &>/dev/null | jq '.result.CacheLimit' 
AssetCacheManagerUtil status -j &>/dev/null | jq '.result.MaxCachePressureLast1Hour' 
AssetCacheManagerUtil status -j &>/dev/null | jq '.result.TotalBytesReturnedToClients' 
AssetCacheManagerUtil status -j &>/dev/null | jq '.result.TotalBytesStoredFromOrigin' 


Visualizing macOS Content Cache Metrics

I’m a big fan of Grafana and Influxdb, so it only makes sense for me to send these metrics to Influxdb so I can build a dashboard with Grafana. What’s nice about sending it to influxdb is you don’t have to convert the bytes, that can be handled directly in Grafana while building the dashboard.

Here’ my script, written in ruby. I run the AssetCacheManagerUtil command and send the data to influxdb.

Then I create a dashboard in Grafana, add a new panel, and select Caching as the measurement. Here I’m selecting the variable cacheused from my ruby script.

After everything is said and done, I have a whole dashboard and finally have some visibility into what caching server is doing, and how much bandwidth it’s saving me.

Download a package from a Jamf Pro Cloud Distribution Point

I ran into a new issue. I have a policy that is pushing a package that I’m not clear on what it’s doing. What’s worse, the policy is pending or failed on a large number of machines. To confuse matters, I have 3 different “Google Chrome” packages but no idea what the differences are.

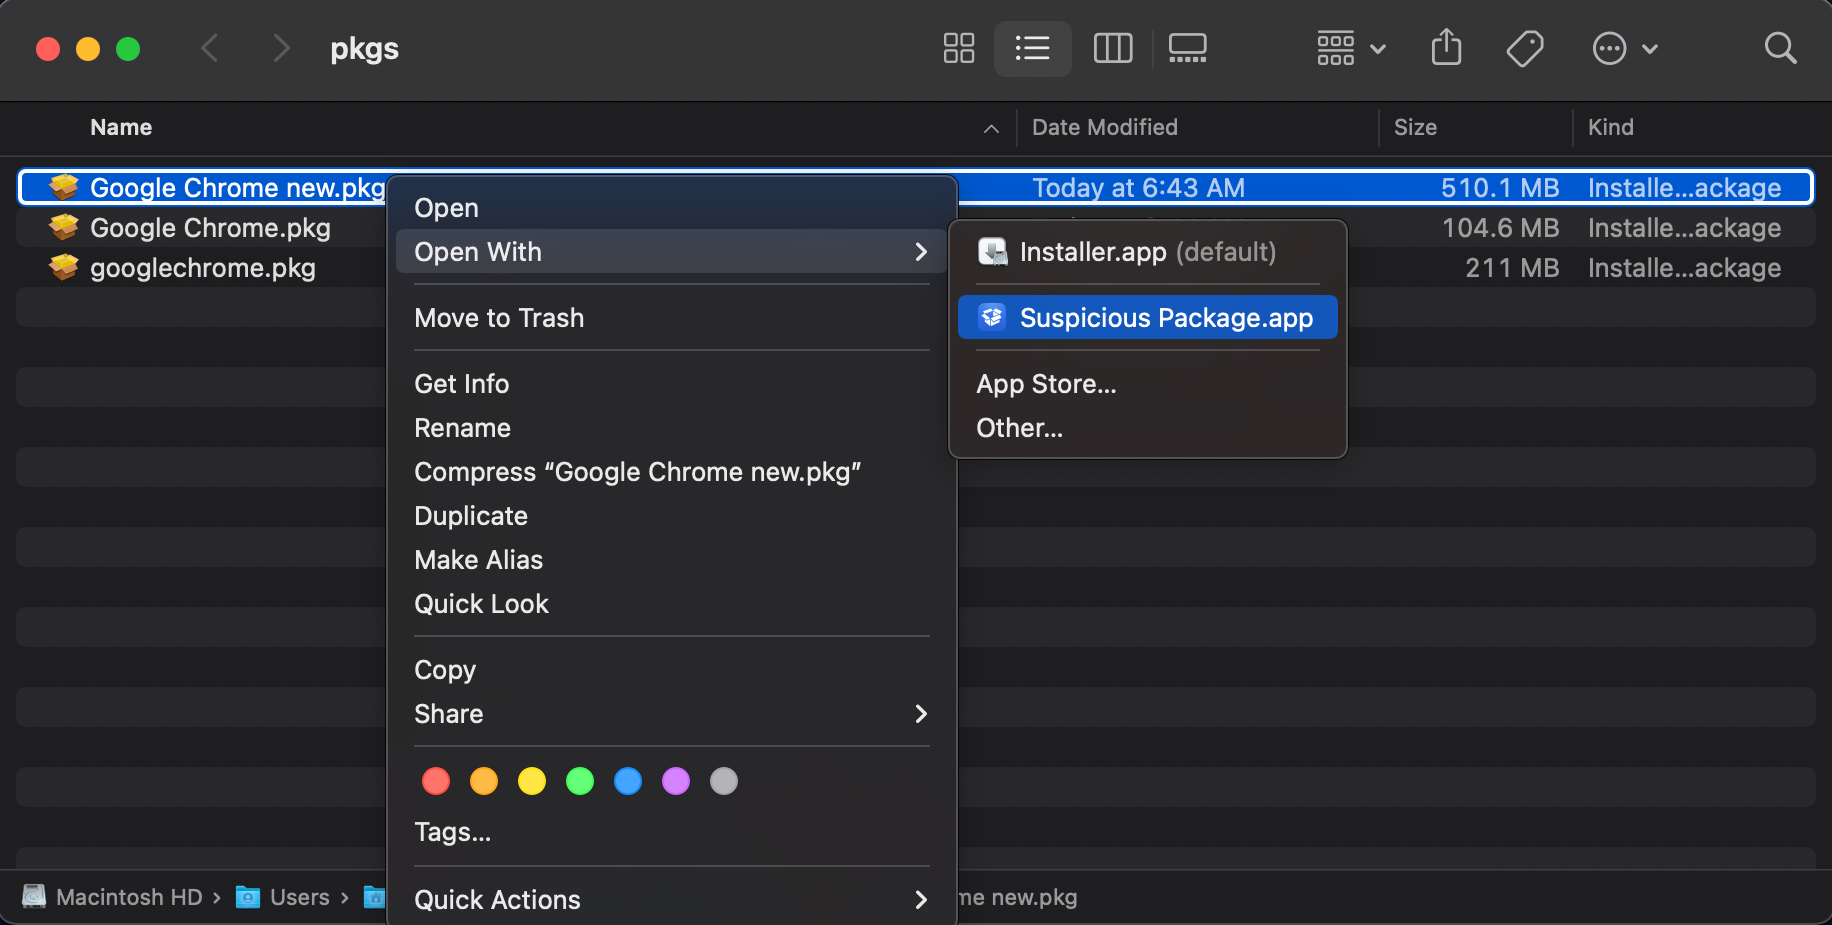
I wanted to download the packages and open them with something like Suspicious Package to see what they are actually doing.

Since there’s no “Download” option in Jamf for your pkg, and I don’t want to install the package to figure out if it’s working. You can create a policy, cache the package, scope it to your machine and then copy the package to your desktop.

  • Create a new policy
  • Add each package you want to download
  • Set the Action to Cache
  • I made the policy available in Self Service, so I wouldn’t have to wait for a check-in
  • Scope the policy to only your machine

After you install the packages. Open Terminal and switch to root. Change to the directory and verify the packages are downloaded.

sh-3.2# sudo su
sh-3.2# cd /Library/Application\ Support/JAMF/Waiting\ Room/
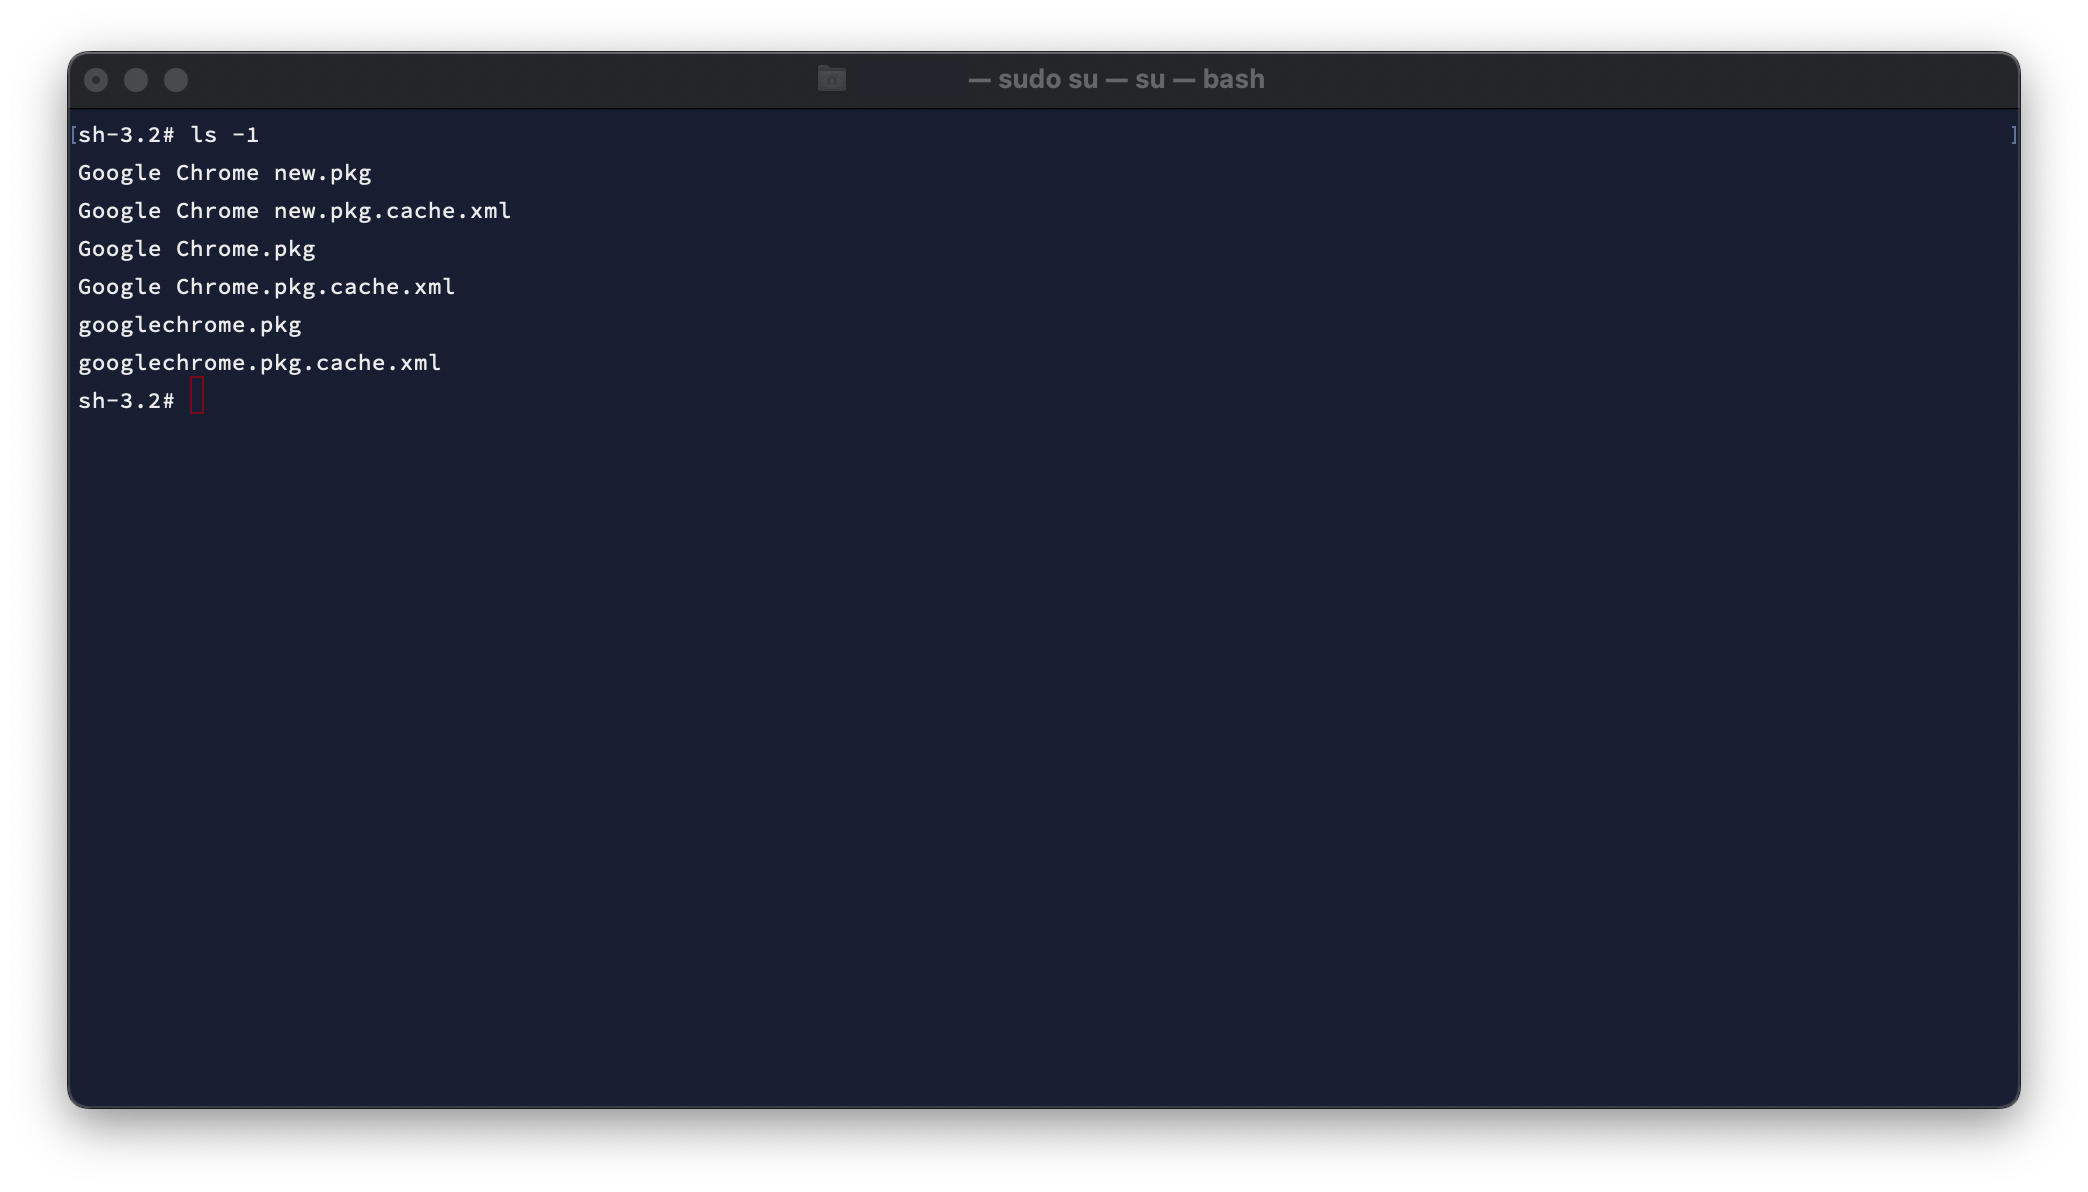
sh-3.2# ls -1

Now, let’s copy the packages (ignore the cache.xml files) to our desktop and change the owner to our account, so we can examine them.

#copy pkgs to your desktop
cp Google Chrome new.pkg /Users/username/Desktop/
cp Google Chrome.pkg /Users/username/Desktop/
cp googlechrome.pkg /Users/username/Desktop/

#change the owner from root, to your user account
chown username /Users/username/Desktop/Google Chrome new.pkg
chown username /Users/username/Desktop/Google Chrome.pkg
chown username /Users/username/Desktop/googlechrome.pkg

If all you needed to do was download the packages, you’re done! In my case, I want to see what they are installing, so I’ll open them with Suspicious Package.


This package, Google Chrome new.pkg is installing v89.04.4389.90! Maybe this was new at some point, but clearly poorly named now.

Turns out the package that was causing me the most issues was googlechrome.pkg which was trying to install Chrome to the System volume, instead of "/Applications“, which was causing it to fail on every client it was scoped to.

macOS: Enable Chrome Auto Updates For All Users

Meant to be run after installing Chrome for the first time on a machine to enable auto updates for all users. Creates the /Library/Google/GoogleSoftwareUpdate folder, including “TicketStore“. Then registers the system for autoupdates.

Before running, /Library/Google/GoogleSoftwareUpdate doesn’t exist


Run the script with Sudo to install to the system wide location at /Library/Google instead of the user location at ~/Library/Google.

 sudo chrome_enable_autoupdates.rb

After running, the folder and ticket store are created


. To check settings after running:

  • Open Chrome
  • Click on Chrome in upper left menu bar
  • Click on “About Google Chrome“
  • Check update settings

The bulk of the work is done by the KSADMIN command to register a keystone ticket and check for updates. Full script can be found here.

  def self.keystone_register
          command = [
             "'#{KSADMIN}'",
             "--register",
             "--productid",          "'#{product_id}'",
             "--version",            "'#{chrome_version}'",
             "--xcpath",             "'#{CHROMEPATH}'",
             "--url",                "'#{update_url}'",
             "--tag-path",           "'#{TAGPATH}'",
             "--tag-key",            "'#{TAGKEY}'",
             "--brand-path",         "'#{BRANDPATH}'",
             "--brand-key",          "'#{BRANDKEY}'",
             "--version-path",       "'#{VERSIONPATH}'",
             "--version-key",        "'#{VERSIONKEY}'",
       "--system-store",
             "2>/dev/null"]
          system("#{command.join(" ")}")
     end

Jenkins Build Scripts For macOS 12 Monterey

I automate part of my macOS builds for new OS releases. I use a simple script (_version_check.sh) that I update with the latest release, ie … 12.2.1. Then I commit it to my repo and fire a webhook to Jenkins. Jenkins takes the version number and checks to see if it’s available via the "softwareupdate" command.

softwareupdate --fetch-full-installer --full-installer-version "$version_to_download"

If it is, it downloads the full installer app, “Install macOS Monterey.app“, to the Applications folder. When that is successful, I have a second Jenkins job that converts the “.app" to a “.dmg" . I archive the “.dmg" and use it in automated workflows with tools like MDS

Scripts are on Github

Showing Bluetooth Battery Percentage On Your Desktop

I use a tool called GeekTool (a fun tool that can be used in a lot of ways) to show the battery percentage of my bluetooth connected devices on my desktop. It makes it easier to keep an eye on them and know when they need charged.

Since switching to an Apple M1 laptop my old script broke, so I took a little time to update it. I used to pull the information from system_profiler but it seems it’s been removed. the ioreg command, now list the current battery percentage of any bluetooth connected devices

ioreg -r -l -k "BatteryPercent"  

This might look like it gives you a lot of output, but we really just need to parse it, to get what we want. The below command will give you current battery percentage for an Apple Magic Keyboard and Magic Mouse. Other products can be listed, but you’d have to run the above ioreg command and get the Product name to switch out in the command.

KeyboardPercent=$(ioreg -r -l -k "BatteryPercent" \
| grep -A 9 "Magic Keyboard with Touch ID" \
| grep "BatteryPercent" \
| awk '{print $3}')

MousePercent=$(ioreg -r -l -k "BatteryPercent" \
| grep -A 9 "Magic Mouse" \
| grep "BatteryPercent" \
| awk '{print $3}')

echo "Keyboard Battery Level: $KeyboardPercent"
echo "Mouse Battery Level: $MousePercent"

Once I have the command working, I update my GeekTool script. There’s a little more formatting here then just show me the percentage and GeekTool is more sensitive to whitespace. The below command is what I use to paste into the script editor to give me the output in the screenshot.

#!/bin/zsh

# Bluetooth Keyboard -----------------------------------------------------------
KeyboardPercent=$(ioreg -r -l -k "BatteryPercent" \
| grep -A 9 "Magic Keyboard with Touch ID" \
| grep "BatteryPercent" \
| awk '{print $3}')

typeset -i b=5
echo "Keyboard:\t\t\c"

if [ ${KeyboardPercent} = 0 ]
then
    echo "Disconnected\c"
else
    if [ $KeyboardPercent -lt 11 ]
    then
        echo "\033[1;31m\c"
    else
        echo "\033[0m\c"
    fi
    while [ $b -le $KeyboardPercent ]
    do
        echo "|\c"
        b=`expr $b + 5`
    done
    while [ $b -le 100 ]
    do
        echo "\033[1;37m|\033[0m\c"
        b=`expr $b + 5`
    done
    echo "\033[0m $KeyboardPercent%\c"
    unset KeyboardPercent
    unset b
fi

echo "\033[0m\nMouse:\t\t\t\c"

# Bluetooth Mouse --------------------------------------------------------------

MousePercent=$(ioreg -r -l -k "BatteryPercent" \
| grep -A 9 "Magic Mouse" \
| grep "BatteryPercent" \
| awk '{print $3}')

if [ ${MousePercent} = 0 ]
then
    echo "Disconnected\c"
else
    if [ $MousePercent -lt 11 ]
    then
        echo "\033[1;31m\c"
    else
        echo "\033[0m\c"
    fi
    typeset -i b=5
    while [ $b -le $MousePercent ]
    do
        echo "|\c"
        b=`expr $b + 5`
    done
    while [ $b -le 100 ]
    do
        echo "\033[1;37m|\033[0m\c"
        b=`expr $b + 5`
    done
    echo "\033[0m $MousePercent%\c"
    unset MousePercent
    unset b
fi

Scripts can be found here

Jenkins Server Not Accessible By IP Address

I installed Jenkins via homebrew on Big Sur 11.4 and couldn’t access the web interface from another computer on the same LAN. Turns out Jenkins default listening address is the loopback,127.0.0.1, so it’s only accessible from the localhost.

You need to update the “homebrew.mxcl.jenkins.plist” file, and change the httpListenAddress to 0.0.0.0. save the file and restart Jenkins.


#stop jenkins 
brew services stop jenkins

#edit plist
sudo nano /usr/local/Cellar/jenkins/2.302/homebrew.mxcl.jenkins.plist 

# change: <string>--httpListenAddress=127.0.0.1</string>
# to:     <string>--httpListenAddress=0.0.0.0</string>

#restart jenkins
brew services start jenkins

The plist file for my system is:

/usr/local/Cellar/jenkins/2.302/homebrew.mxcl.jenkins.plist

Azure: Adding A Network Security Rule To An Existing Network Security Group

This has caused me a lot of pain, I hope it saves someone else.

One of the things I do after creating a new VM in Azure is add rules to the NSG. This can be mundane and error prone, especially if you have a lot of rules. It’s much easier to deploy your VM with the basic RDP rule and then add your custom rules later. It’s even easier if you can script it. I prefer to use Powershell and the the AZ module on macOS, that way I don’t have to switch computers.

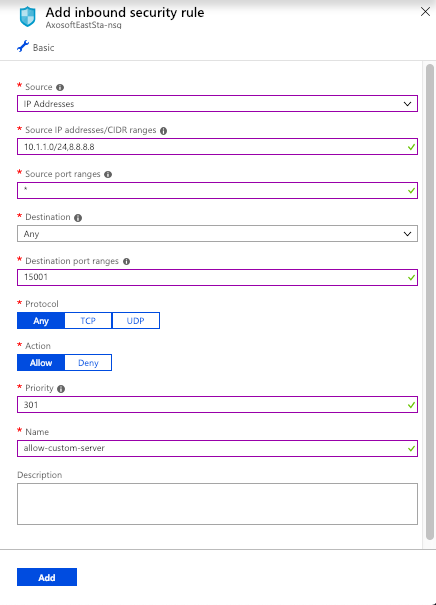
One of the issues I had was adding a NSG rule where “-SourceAddressPrefix” had multiple values. I can easily do this in the GUI by adding the rule manually.

(The IP addresses are just an example to show an IP address and a CIDR notation)

Screen Shot 2018-12-27 at 7.25.42 PM

If I click add here, I create a new rule. But I want to do this with Powershell. But every time I run my script, I get a 400 error on “SourceAddressPrefix”, telling me it’s a bad request. To make it worse, Microsoft doesn’t even offer an example in the official documentation of how to add more than 1 IP or CIDR value.

It took a lot of just trial and error, but I finally got it. If you’re passing more than 1 value to “-SourceAddressPrefix”, it expects that the “,” is NOT in quotations.

So where it feels natural to create a variable like this:

$officeWhiteList = "8.8.8.8,10.1.1.0/24"

It’s wrong. Your “,” is inside the quotes. If you change it to this:

$officeWhiteList = "8.8.8.8","10.1.1.0/24"

It works! Some simple documentation or better error messages would have saved me a ton of time. Here’s my full example to add a network security rule to an existing NSG:

#---------------------------------------------------------------------------
# Summary:
# Add an Azure Network Security Group Rule to an existing NSG

#---------------------------------------------------------------------------
$subscriptionToUse = "12345678-1234-1234-1234-123456789012" #just an example
$officeWhiteList = "8.8.8.8","10.1.1.0/25" #just an example
$rgName = "Resource-Group"
$nsgName = "Resource-Group-nsg"
$customServerRule = "allow-custom-server"
$customServerPort = 15001

# Select subscription ------------------------------------------------------
Set-AzureRmContext -SubscriptionId $subscriptionToUse

# Get the NSG resource -----------------------------------------------------
$resource = Get-AzureRmResource | Where-Object `
{$_.ResourceGroupName `
–eq $rgName `
-and $_.ResourceType `
-eq "Microsoft.Network/networkSecurityGroups"}

$nsg = Get-AzureRmNetworkSecurityGroup `
-Name $nsgName `
-ResourceGroupName $rgName

# Add customServerPort --------------------------------------------------------
$nsg | Add-AzureRmNetworkSecurityRuleConfig `
-Name $customServerRule `
-Description $customServerRule `
-Access Allow `
-Protocol * `
-Direction Inbound `
-Priority 301 `
-SourceAddressPrefix $officeWhiteList `
-SourcePortRange * `
-DestinationAddressPrefix * `
-DestinationPortRange $customServerPort

# Save changes to NSG ------------------------------------------------------
$nsg | Set-AzureRmNetworkSecurityGroup

If you want to add more than 1 rule, just add another “$nsg | Add-AzureRmNetworkSecurityRuleConfig” statement. When you’re done, make sure the last statement is “$nsg | Set-AzureRmNetworkSecurityGroup“, this saves your changes to the NSG

Using Jenkins to build macOS installers

Screen Shot 2017-11-26 at 1.34.58 PM.png

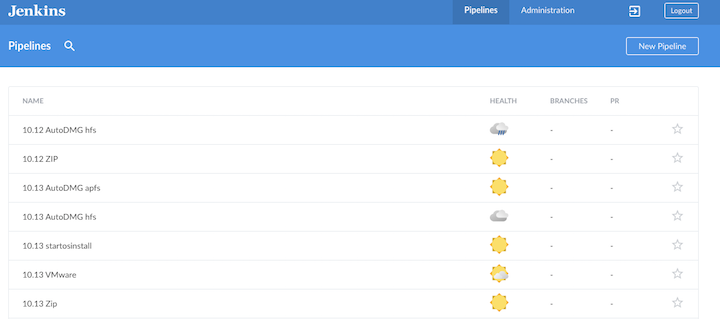
Each time Apple releases a new OS, it triggers a whole lot of building and testing. New AutoDMG images, new VM’s for testing, archiving of media, etc …

I use various ways to script and automate to get what I need. That is, until I realized this is exactly what Jenkins excels at. Anything I can automate, Jenkins can run for me, sometimes without any user interaction.

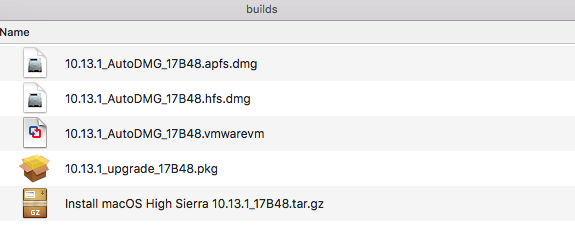
Currently when Apple post a new macOS High Sierra installer on the App Store. I Download it and build the following:

• zip archive of the installer
• hfs AutoDmg installer
• apfs AutoDmg installer
• vmware image for VMware Fusion
• macOS ‘upgrade’ pkg with startosinstall

Instead of me running five individual scripts, I have Jenkins running a series of chained tasks. The first task is to simply make a zip archive of the “macOS Install High Sierra.app”, after this task is successful the next downstream build is using the AutoDMG cli commands to build an “Out of the box” Apple installer for a DeployStudio workflow, followed by another AutoDMG cli to build an APFS installer.

Next with the help of vfuse, I take an AutoDMG installer and convert it into “vmware” image that I can use immediately for testing critical internal services and workflows like encryption, domain settings, printers, etc …. Lastly with the help of munkipkg, I take the original installer in the “/Applications” folder and build a new pkg that drops it into the “/tmp” folder on a new machine .Then a postintall script calls “sartosinsall” to perform an in-place upgrade.

All of these builds are running in the background on a Jenkins slave machine that is running macOS, and the end result should be a folder full of installers ready for testing.

Screen Shot 2017-11-27 at 8.45.55 AM.png

The scripts are available on Github, but may need to be slightly modify for you’re environment.

Installing Certificates on macOS with Puppet

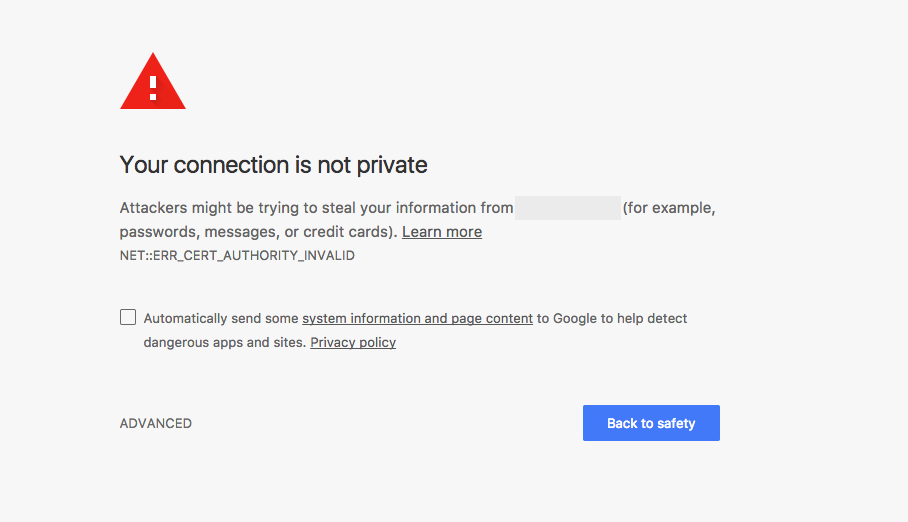
I have lots of internal web servers that use self signed certs for HTTPS encryption. Every time I try to login to theses server I get the “Your connection is not private” message.

Screen Shot 2017-10-13 at 6.41.26 PM.png

It’s not that it’s a big deal, but it’s annoying since I use multiple computers for admin work. Let’s get puppet to solve this problem.

I started with an external fact that I placed in my module, in the facts.d folder (you have to create this folder). It simply checks to see if I can find the certificate in the system keychain and sets a variable … either “cert_installed=true” or “cert_installed=false”.

#!/usr/bin/ruby
check_cert="security find-certificate -a server.company.edu.cer -k /Library/Keychains/System.keychain | grep \"server.company.edu\" >/dev/null"

if system(check_cert) == true
  puts "cert_installed=true"
else
  puts "cert_installed=false"
end

The in the manifest … I check if the cert is installed and if it’s false, I copy the cert to the /tmp folder and then run a command to install it and trust it.

 class cert {
	if $facts['cert_installed'] == 'false' {
		file { "/tmp/server.company.edu.cer":
			mode => "0777",
	  		owner => 'root',
		  	group => 'wheel',
		  	source => "puppet:///modules/cert/server.company.edu.cer",
		}
		exec { "server.company.edu.cer":
	  		command => 'sudo security add-trusted-cert -d -r trustAsRoot -k /Library/Keychains/System.keychain "/tmp/server.company.edu.cer"',
			path	=> ["/bin", "/usr/bin", "/sbin", "/usr/sbin"],
			require => File["/tmp/server.company.edu.cer"]
		}
	}
}

This has been working beautifully.