Tag Archives: influxdb

macOS Content Caching Metrics

Content caching is a service in macOS that speeds up downloading of software distributed by Apple and data that users store in iCloud by saving content that local Apple devices have already downloaded. If you’ve enabled it in “System Preferences > Sharing > Content Caching”. You know that it couldn’t be easier to set up. But have you ever wondered, what is content caching doing? Is it even working?

Luckily Apple has provided the AssetCacheManagerUtil command-line tool to manage content caching, with the status option that will output some metrics.

AssetCacheManagerUtil status                                                          
2022-06-19 15:14:20.159 AssetCacheManagerUtil[95604:12021093] Content caching status:
    Activated: true
    Active: true
    ActualCacheUsed: 61.6 GB
    CacheDetails: (4)
        iCloud: 5.62 GB
        iOS Software: 7.54 GB
        Mac Software: 34.31 GB
        Other: 29.13 GB
    CacheFree: 110.83 GB
    CacheLimit: 250 GB
    CacheStatus: OK
    CacheUsed: 76.6 GB
    MaxCachePressureLast1Hour: 0%
    Parents: (none)
    Peers: (none)
    PersonalCacheFree: 110.83 GB
    PersonalCacheLimit: 250 GB
    PersonalCacheUsed: 5.62 GB
    Port: 56183
    PrivateAddresses: (1)
        10.0.1.102
    PublicAddress: xx.xx.xx.xx
    RegistrationStatus: 1
    RestrictedMedia: false
    ServerGUID: D2BE5986-6E42-41AC-845D-27A87C6EE6B6
    StartupStatus: OK
    TetheratorStatus: 0
    TotalBytesAreSince: 2022-05-10 12:10:15
    TotalBytesDropped: 7.3 MB
    TotalBytesImported: 1.72 GB
    TotalBytesReturnedToChildren: Zero KB
    TotalBytesReturnedToClients: 135.66 GB
    TotalBytesReturnedToPeers: Zero KB
    TotalBytesStoredFromOrigin: 59.88 GB
    TotalBytesStoredFromParents: Zero KB
    TotalBytesStoredFromPeers: Zero KB

This is a good start but you might want to know, what does TotalBytesReturnedToClients mean? You can reference all the metrics in Apple’s Developer Docs. Where we can find that TotalBytesReturnedToClients is:

The amount of data, in bytes, that the content cache served to client iOS, macOS, and tvOS devices since the TotalBytesAreSince date.

This is progress. But the AssetCacheManagerUtil tool spits out one large json output. How can I pull individual metrics?

jq is a lightweight and flexible command-line JSON processor that can be easily installed with home-brew.

brew install jq

And with the below command, you can parse the output for a single metric:


AssetCacheManagerUtil status -j 2>/dev/null | jq '.result.TotalBytesReturnedToClients'
135658827669

But now you’ll notice the output isn’t nice and human-readable like it was before we parsed it, jq will return values in bytes. You’ll need to convert it to MB’s or GB’s if you want.

Now that we can use jq , we can pull the metrics we care about:


AssetCacheManagerUtil status -j &>/dev/null | jq '.result.Active'  
AssetCacheManagerUtil status -j &>/dev/null | jq '.result.ActualCacheUsed'  
AssetCacheManagerUtil status -j &>/dev/null | jq '.result.CacheDetails.iCloud' 
AssetCacheManagerUtil status -j &>/dev/null | jq '.result.CacheDetails."iOS Software"'  
AssetCacheManagerUtil status -j &>/dev/null | jq '.result.CacheDetails."Mac Software"'   
AssetCacheManagerUtil status -j &>/dev/null | jq '.result.CacheDetails.Other' 
AssetCacheManagerUtil status -j &>/dev/null | jq '.result.CacheFree' 
AssetCacheManagerUtil status -j &>/dev/null | jq '.result.CacheUsed'  
AssetCacheManagerUtil status -j &>/dev/null | jq '.result.CacheLimit' 
AssetCacheManagerUtil status -j &>/dev/null | jq '.result.MaxCachePressureLast1Hour' 
AssetCacheManagerUtil status -j &>/dev/null | jq '.result.TotalBytesReturnedToClients' 
AssetCacheManagerUtil status -j &>/dev/null | jq '.result.TotalBytesStoredFromOrigin' 


Visualizing macOS Content Cache Metrics

I’m a big fan of Grafana and Influxdb, so it only makes sense for me to send these metrics to Influxdb so I can build a dashboard with Grafana. What’s nice about sending it to influxdb is you don’t have to convert the bytes, that can be handled directly in Grafana while building the dashboard.

Here’ my script, written in ruby. I run the AssetCacheManagerUtil command and send the data to influxdb.

Then I create a dashboard in Grafana, add a new panel, and select Caching as the measurement. Here I’m selecting the variable cacheused from my ruby script.

After everything is said and done, I have a whole dashboard and finally have some visibility into what caching server is doing, and how much bandwidth it’s saving me.

Monitor Scheduled Tasks on Windows Server

Scheduled Tasks are a great way to run scripts at specified time intervals. Similar to Unix cron. Because it’s such a powerful tool, it can be easy to abuse by programs that install their own schedule tasks. Most times without any transparency to the user that a task is being created. It’s also a potential target for malware to install persistent tasks that go unnoticed.

On managed servers, I want transparency into which tasks are installed. I created a powershell script with an array of “whitelisted” tasks, then created a scheduled tasks to check the name of the scheduled tasks installed. The results are sent to InfluxDB and If a task is not on my white list, an alert is sent with Grafana.

The powershell script and scheduled task can be found here.

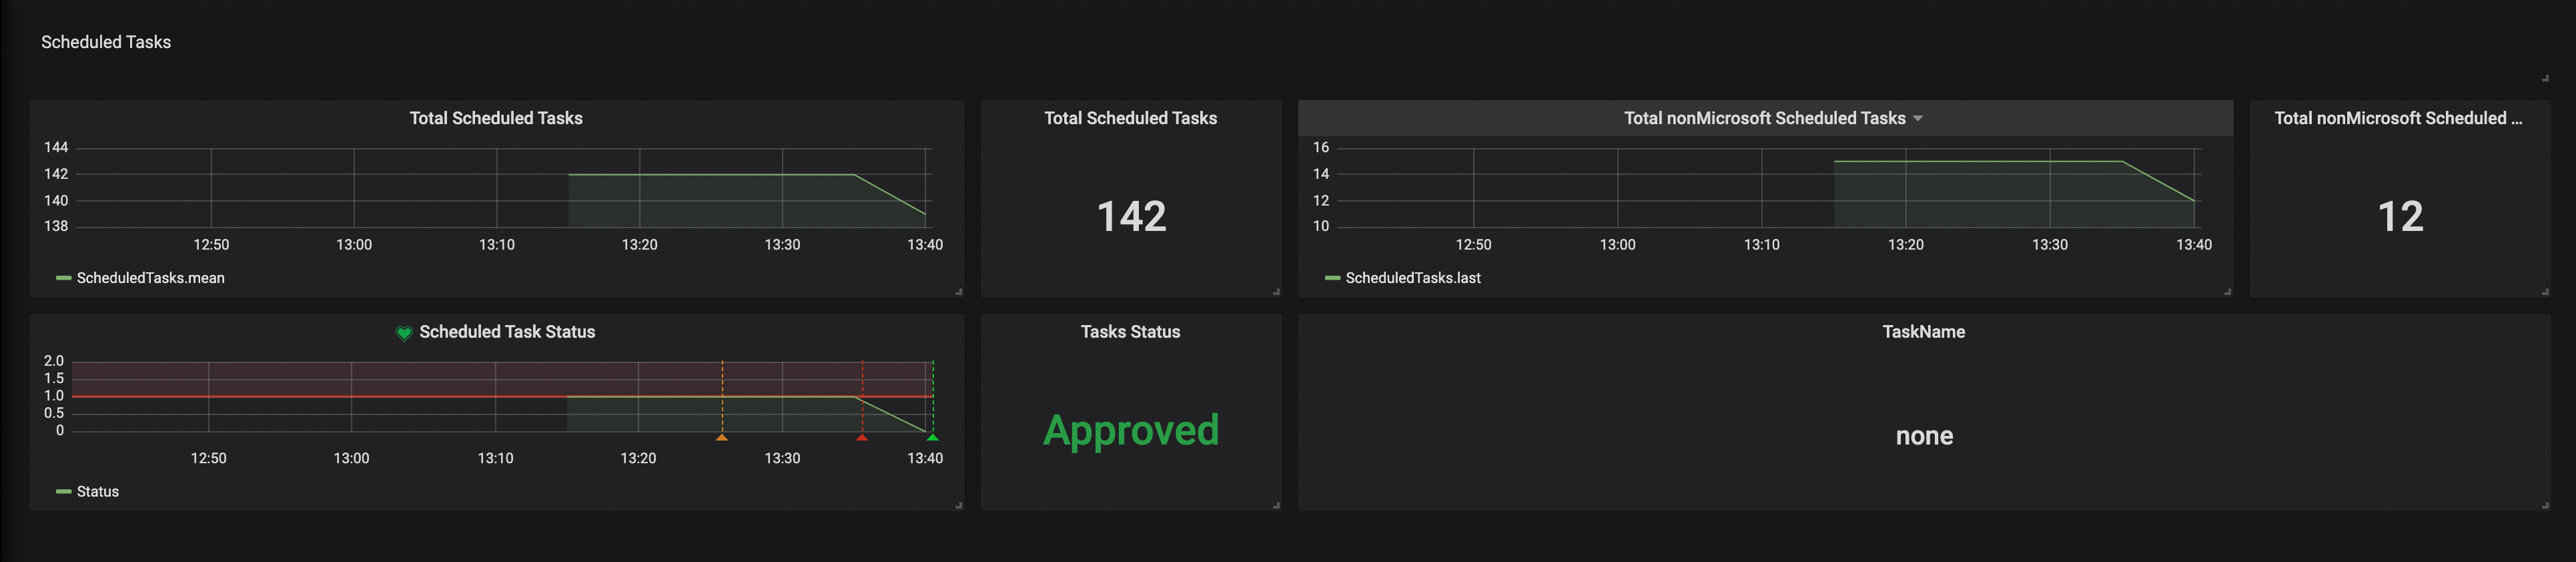
When first installed, it reports the total number of scheduled tasks, and total number of non-Microsoft tasks. By default, I ignore Microsoft tasks installed on a new install.

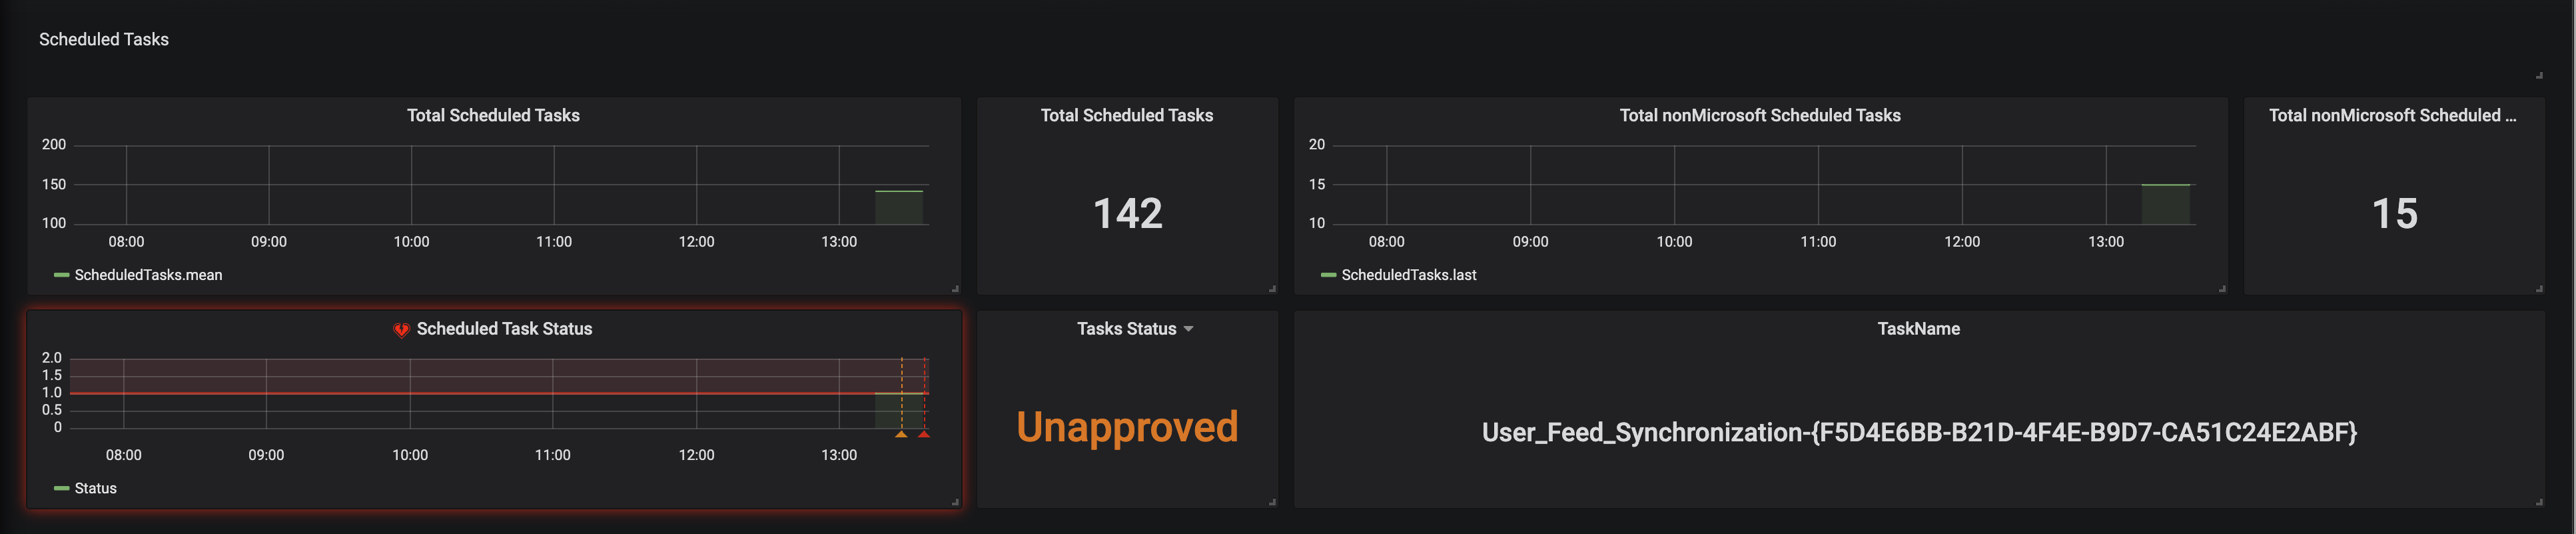
In this scenario you can see an alert has been triggered, because there is an Unapproved task, and to the right, it shows the name of the task, User_Feed_ ...

Now you can log into the computer and check the task to decided if it needs added to your white list or deleted.

Once the task has been deleted, the alarm is cleared and all tasks report as Approved

Getting Windows Performance Counters Into InfluxDB and Grafana

I needed to get some Windows performance counters into InfluxDB, so I could setup some dashboards with Grafana. I’ve seen others post their default telegraf.conf files with the baseline CPU, Memory, Disk, etc … metrics. But I needed to track some non-default metrics. Like, “SQL Server Batch Requests/sec“. I started out writing my own powershell, parsing the data and sending an “Invoke-WebRequest” to my InfluxDB with Line Protocol data.

Then I realized, I could probably copy an existing “[[inputs.win_perf_counters.object]]“ from the default telegraf.conf file. Then dig into Windows Performance Monitor to find the exact metric I need, and just switch the “ObjectName” and “Counters” out.

This is my example with Batch Requests/sec

  • Open Windows Performance Monitor
  • Click the green “+" button to add a counter
  • Find the counter you want, in this case “SQLServer:SQL Statistics“
  • Click the “upside down arrow” to the right
  • Select “Batch Requests/sec“
  • Click the “Add” button
  • Click “OK” to close the window
  • Verify you get the metrics you want
  • Make a note of the “Counter“, “Instance“, and “Object” names
  • Open your “telegraf.conf” file
  • Under the “Inputs” sections, copy an existing “[[inputs.win_perf_counters.object]]” section
  • Update “ObjectName” with the “Object” from Windows Performance Monitor
  • Update “Counters“, with the “Counter” name from Windows Performance Monitor
  • Update “Instances” with the instance name from Windows Performance Monitor. In this case “*” to choose All, since there is no specific name
  • Update “Measurement” with a name for the collection you want to use in InfluxDB to store the metrics. For this example, “win_sql“
  • Login to Grafana and add a new panel
  • Select your measurement from the telegraf.conf file (win_sql)
  • Select the Counter from the telegraf.conf file ,in the field box (Batch Requests/sec)

Setup Grafana, Influxdb, and Telegraf on Ubuntu 18.04

There’s great how-tos out there, like this and this. This is just the striped down steps that worked for me. I’m not a expert in any of these services.

Overview:

Assuming you already have an Ubuntu VM/box setup and configured how you want.

  • Install & Configure Influxdb
  • Install & Configure Telegraf
  • Install & Configure Grafana
  • Configure SSL With Self-Signed Certs For Grafana
  • Setup Influxdb With Self-Signed Certs

Install & Configure Influxdb
See documentation for changes or newer versions.

Default config file: /etc/influxdb/influxdb.conf

Install influxdb 1.7.3 (current version at the time), and set as a service to start at boot:

wget https://dl.influxdata.com/influxdb/releases/influxdb_1.7.3_amd64.deb
sudo dpkg -i influxdb_1.7.3_amd64.deb
sudo systemctl start influxdb
sudo systemctl enable influxdb

create the default influxdb database and user:

create database telegraf
create user telegraf with password 'password'
GRANT ALL ON telegraf TO telegraf

Set a retention policy name “Two_Weeks” for db telegraf, set it to 14 days and make it the default policy:

CREATE RETENTION POLICY Two_Weeks ON telegraf DURATION 14d REPLICATION 1 DEFAULT

Sanity checks to show that the db, user, and retention policy were created:

show databases
show users
SHOW RETENTION POLICIES ON telegraf

Install & Configure Telegraf

See documentation for changes or newer versions.
Default config file: /etc/telegraf/telegraf.conf

Install Telegraf 1.9.2 (current version at the time), and start as a network service at boot:

wget https://dl.influxdata.com/telegraf/releases/telegraf_1.9.2-1_amd64.deb
sudo dpkg -i telegraf_1.9.2-1_amd64.deb
sudo systemctl start telegraf
sudo systemctl enable telegraf
Create Telegraf Configuration File

If /etc/telegraf/telegraf.conf already exist make sure at least these options are uncommented and updated to your appropriate settings. Other wise create the file and paste these settings in.

[agent]
hostname = "nameofyourgrafanaserver"
flush_interval = "15s"
interval = "15s"

[[inputs.cpu]]

[[inputs.mem]]

[[inputs.system]]

[[inputs.disk]]
mount_points = ["/"]

[[inputs.processes]]

[[inputs.net]]
fieldpass = [ "bytes_*" ]

[[outputs.influxdb]]
database = "telegraf"
urls = [ "http://127.0.0.1:8086" ]
username = "telegraf"
password = "password"

After updating the config file, always restart Telegraf:

sudo systemctl restart telegraf

To test that Telegraf is setup correct:

#path_to_telegraf -test -config /path_to_telegraf.conf
telegraf -test -config /etc/telegraf/telegraf.conf

Install & Configure Grafana

See documentation for changes or newer versions.

Default config file: /etc/grafana/grafana.ini

Default log file: /var/log/grafana

Install Grafana 5.4.3 (current version at the time), and set as a network service at boot.

wget https://dl.grafana.com/oss/release/grafana_5.4.3_amd64.deb
sudo apt-get install -y adduser libfontconfig
sudo dpkg -i grafana_5.4.3_amd64.deb
sudo systemctl daemon-reload
sudo systemctl start grafana-server
sudo systemctl status grafana-server
sudo systemctl enable grafana-server.service

Logging in for the first time:

To run Grafana open your browser and go to http://localhost:3000/. 3000 is the default http port that Grafana listens to if you haven’t configured a different port. The defaults login ia admin/admin

Configure SSL With Self-Signed Certs For Grafana

Steps to enable SSL for Grafana. Change to the grafana config directory and create certs:

cd /etc/grafana
sudo openssl req -x509 -newkey rsa:2048 -keyout grafana-key.pem -out grafana-cert.pem -days 3650 -nodes

After creating the .pem files. Change the mode and owner:

sudo chmod 644 grafana-key.pem
sudo chmod 644 grafana-cert.pem
sudo chown root grafana-key.pem
sudo chown root grafana-cert.pem

Update /etc/grafana/grafana.ini with these options:

# Protocol (http, https, socket)
protocol = https

# https certs & key file
cert_file =/etc/grafana/grafana-cert.pem
cert_key =/etc/grafana/grafana-key.pem

Restart Grafana:

systemctl restart grafana-server

You should be able to access Grafana on https://localhost:3000/

Setup Influxdb With Self-Signed Certs:

Create the certs:

sudo openssl req -x509 -nodes -newkey rsa:2048 -keyout /etc/ssl/influxdb-selfsigned.key -out /etc/ssl/influxdb-selfsigned.crt -days 3650

After creating the .pem files. Change the mode and owner:

sudo chmod 644 /etc/ssl/influxdb-selfsigned.crt
sudo chmod 644 /etc/ssl/influxdb-selfsigned.key
sudo chown root /etc/ssl/influxdb-selfsigned.crt
sudo chown root /etc/ssl/influxdb-selfsigned.key

Update the influxdb.conf file:

[http]

#Determines whether HTTPS is enabled.
https-enabled = true

#The SSL certificate to use when HTTPS is enabled.
https-certificate = "/etc/ssl/influxdb-selfsigned.crt"

#Use a separate private key location.
https-private-key = "/etc/ssl/influxdb-selfsigned.key"

Restart influxdb:

sudo systemctl restart influxdb

You also need to update Telegraf so it knows to use ssl when sending to influxdb. Update the telegraf.config file.

sudo nano /etc/telegraf/telegraf.conf

Update these settings:

[[outputs.influxdb]]
urls = ["https://127.0.0.1:8086"]

## Optional TLS Config for use on HTTP connections.
insecure_skip_verify = true

## HTTP Basic Auth
username = "telegraf"
password = "password"

Log into Grafana web and update the Influxdb datasoure:
– change URL to https://localhost:8086
– check box for Skip TLS Verify

That’s it. You should be able to create a new dashboard in Grafana and start adding panels with stats collected from Telegraf on the local Ubuntu machine.