Getting Windows Performance Counters Into InfluxDB and Grafana

I needed to get some Windows performance counters into InfluxDB, so I could setup some dashboards with Grafana. I’ve seen others post their default telegraf.conf files with the baseline CPU, Memory, Disk, etc … metrics. But I needed to track some non-default metrics. Like, “SQL Server Batch Requests/sec“. I started out writing my own powershell, parsing the data and sending an “Invoke-WebRequest” to my InfluxDB with Line Protocol data.

Then I realized, I could probably copy an existing “[[inputs.win_perf_counters.object]]“ from the default telegraf.conf file. Then dig into Windows Performance Monitor to find the exact metric I need, and just switch the “ObjectName” and “Counters” out.

This is my example with Batch Requests/sec

  • Open Windows Performance Monitor
  • Click the green “+" button to add a counter
  • Find the counter you want, in this case “SQLServer:SQL Statistics“
  • Click the “upside down arrow” to the right
  • Select “Batch Requests/sec“
  • Click the “Add” button
  • Click “OK” to close the window
  • Verify you get the metrics you want
  • Make a note of the “Counter“, “Instance“, and “Object” names
  • Open your “telegraf.conf” file
  • Under the “Inputs” sections, copy an existing “[[inputs.win_perf_counters.object]]” section
  • Update “ObjectName” with the “Object” from Windows Performance Monitor
  • Update “Counters“, with the “Counter” name from Windows Performance Monitor
  • Update “Instances” with the instance name from Windows Performance Monitor. In this case “*” to choose All, since there is no specific name
  • Update “Measurement” with a name for the collection you want to use in InfluxDB to store the metrics. For this example, “win_sql“
  • Login to Grafana and add a new panel
  • Select your measurement from the telegraf.conf file (win_sql)
  • Select the Counter from the telegraf.conf file ,in the field box (Batch Requests/sec)

Setup Telegraf on an Apple M1 Mac Mini

I’m setting up a couple of Apple M1 Build servers and part of the setup is pushing metrics into Grafana with Telegraf. Here’s my basic install and setup.

Download and Install Telegraf

Down the installer from: https://portal.influxdata.com/downloads

Because this is a M1 Mac mini, I selected “macOS ARM64 (via singed .dmg)“

Expand dmg and copy Telegraf.app to the “/Applications” folder

Open the Telegraf.app and allow permissions to terminal

Set config File

I copy the config from a previous install or create /Applications/Telegraf.app/Contents/Resources/etc/telegraf/telegraf.conf . I used the defaults below. Theres nothing fancy going on here, I’m using the defaults from the example conf file.

# Telegraf Configuration

# Global tags can be specified here in key="value" format.
[global_tags]

# Configuration for telegraf agent
[agent]
  interval = "60s"
  round_interval = true
  metric_batch_size = 1000
  metric_buffer_limit = 10000
  collection_jitter = "0s"
  flush_interval = "10s"
  flush_jitter = "0s"
  precision = "s"
  hostname = ""
  omit_hostname = false

###################################################################
#                            OUTPUT PLUGINS                                   #
###################################################################
[[outputs.influxdb]]
  urls = ["http://servername:8086"]
  database = "telegraf"
  timeout = "5s"


###################################################################
#                            INPUT PLUGINS                                    #
###################################################################
# Read metrics about cpu usage
# [[inputs.cpu]]

# Read metrics about disk usage by mount point
[[inputs.disk]]
  ## Ignore mount points by filesystem type.
  ignore_fs = ["tmpfs", "devtmpfs", "devfs", "iso9660", "overlay", "aufs", "squashfs"]

# Get kernel statistics from /proc/stat
[[inputs.kernel]]
  # no configuration

# Read metrics about memory usage
[[inputs.mem]]
  # no configuration

# Get the number of processes and group them by status
[[inputs.processes]]
  # no configuration

# Read metrics about swap memory usage
[[inputs.swap]]
  # no configuration

# Read metrics about system load & uptime
[[inputs.system]]
  ## Uncomment to remove deprecated metrics.
  # fielddrop = ["uptime_format"]

Launch at Startup

Then I create a Launchagent for the user running telegraf. I copy the below and put it at ~/Library/Launchagents/com.telegraf.plist

<?xml version="1.0" encoding="UTF-8"?>
<!DOCTYPE plist PUBLIC "-//Apple//DTD PLIST 1.0//EN" "http://www.apple.com/DTDs/PropertyList-1.0.dtd">
<plist version="1.0">
<dict>
    <key>EnvironmentVariables</key>
    <dict>
        <key>PATH</key>
        <string>/usr/local/bin:/usr/bin:/bin:/usr/sbin:/sbin:/Library/Apple/usr/bin:/usr/local/sbin</string>
    </dict>
    <key>KeepAlive</key>
    <dict>
        <key>SuccessfulExit</key>
        <true/>
    </dict>
    <key>Label</key>
    <string>com.telegraf</string>
    <key>ProgramArguments</key>
    <array>
        <string>/Applications/Telegraf.app/Contents/Resources/usr/bin/telegraf</string>
        <string>--config</string>
        <string>/Applications/Telegraf.app/Contents/Resources/etc/telegraf/telegraf.conf</string>
    </array>
    <key>RunAtLoad</key>
    <true/>
</dict>
</plist>

Then I reboot the machine and log into my Grafana server. Duplicate an existing Dashboard from another build server and then wait a couple minutes and refresh until I see the new hostname pop up.

You can download the config files here

Setting Up SFTP on Ubuntu 20.04

Basic SFTP Setup

A recent project had me doing a quick refresh of how to setup an SFTP server. I thought I’d put those steps here. To setup a basic SFTP server on ubuntu, we’ll create a a dedicated sftp user and group, and a directory for the root sftp connection. Then lock down the directory to only users in our sftp group.

Start by creating a new group.

sudo addgroup sftp_group

Create a new user specifically for SFTP, and add them to the group. Use the “-M" flag will create a user without a home to directory.

sudo useradd -M sftp_user -g sftp_group

Create a password for the user:

sudo passwd sftp_user

Now we need to create a root directory for SFTP and make sure root is the owner

sudo mkdir -p /sftp
chown root:root /sftp

Now create a SFTP directory for our user and lock permission to only this user

sudo mkdir /sftp/Data
sudo chown sftp_user:sftp_group /sftp/Data
sudo chmod 700 /sftp/Data

It’s time to install ssh

sudo apt-get install ssh

Edit the config.

sudo nano /etc/ssh/sshd_config

Add these settings to end of the file for our sftp settings:

Match group sftp_group
ChrootDirectory /sftp
X11Forwarding no 
AllowTcpForwarding no 
ForceCommand internal-sftp

You can add or uncomment any additional settings to the file that you need as well. Here’s a few I added.

Change the default ssh port:

Port 4422

Change logging level:

LogLevel VERBOSE

Disable root ssh:

PermitRootLogin no

Set session timeout. This will disconnect idle connections after 5 minutes.

ClientAliveInterval 300

When you’re done editing the file, restart ssh service:

sudo systemctl restart ssh

Connect to SFTP Server

To test your connection, open an sftp client like FileZilla and create a new site (File > Site manager > new site). Enter the IP or hostname of the sftp server, the port number, and username and password. Then hit “Connect“

If successful, you should open to the default directory in your “sshd_config” file (/sftp). Open the “Data” folder, create a txt file and upload to the server.

Jenkins Server Not Accessible By IP Address

I installed Jenkins via homebrew on Big Sur 11.4 and couldn’t access the web interface from another computer on the same LAN. Turns out Jenkins default listening address is the loopback,127.0.0.1, so it’s only accessible from the localhost.

You need to update the “homebrew.mxcl.jenkins.plist” file, and change the httpListenAddress to 0.0.0.0. save the file and restart Jenkins.


#stop jenkins 
brew services stop jenkins

#edit plist
sudo nano /usr/local/Cellar/jenkins/2.302/homebrew.mxcl.jenkins.plist 

# change: <string>--httpListenAddress=127.0.0.1</string>
# to:     <string>--httpListenAddress=0.0.0.0</string>

#restart jenkins
brew services start jenkins

The plist file for my system is:

/usr/local/Cellar/jenkins/2.302/homebrew.mxcl.jenkins.plist

Use OpenSSL to Create a Self-Signed Certificate With Subject Alternative Names

Part of running a lot of self-hosted test servers for developers is setting up SSL to verify things like API calls work the way you expect. With recent changes in web browsers, specifically Chrome, rejecting certificates that don’t have Subject Alternative Names. I had to document how to create self-signed certs with the proper SAN fields. I generally create the certificates on my Mac and scp them to the local webserver. In this example, I was creating certs for a self-hosted gitlab server.

Instructions

To create a self-signed SAN certificate with multiple subject alternate names, complete the following procedure:

Create an OpenSSL configuration file on the local computer, edit the fields in [req_distinguished_name] and [alt_names] to make them relevant to you.

Example: gitlab-ce.conf

[req]
default_bits = 2048
distinguished_name = req_distinguished_name
x509_extensions = v3_req
prompt = no

[req_distinguished_name]
C = US
ST = AZ
L = Scottsdale
O = companyname
OU = companydepartment
CN = gitlab-ce

[v3_req]
keyUsage = nonRepudiation, digitalSignature, keyEncipherment
extendedKeyUsage = serverAuth
subjectAltName = @alt_names

[alt_names]
DNS.1 = gitlab-ce
DNS.2 = gitlab-ce.example.local

Create the certificate. I prefer to cd into the directory with my .conf file before running the command

openssl req -x509 -nodes -days 3500 -newkey rsa:2048 \
-keyout gitlab-ce.example.local.key \
-out gitlab-ce.example.local.crt \
-config gitlab-ce.conf \
-extensions 'v3_req'
# Command Usage ------------------------------------------------
req The command creates and processes certificate requests
-x509: Create a self-signed certificate
-nodes: Create a certificate that does not require a passphrase
-days: the length of time in days for the certificate
-newkey rsa:2048: Create a RSA key for use with the certificate
-keyout private key out path
-out public key out path
-config Specify an alternative configuration file
-extensions alternative sections to include

Run the following command to verify the certificate

openssl x509 -in gitlab-ce.example.local.crt -noout -text

Check the output for X509v3 Subject Alternative Name:

   Certificate:
       Data:
           Version: 3 (0x2)
           Serial Number: 11345571246859837741 (0x9d7390f006f7612d)
       Signature Algorithm: sha256WithRSAEncryption
           Issuer: C=US, ST=AZ, L=Scottsdale, O=companyname, OU=companydepartment, CN=gitlab-ce
           Validity
               Not Before: Mar  3 15:35:36 2020 GMT
               Not After : Oct  2 15:35:36 2029 GMT
           Subject: C=US, ST=AZ, L=Scottsdale, O=companyname, OU=companydepartment, CN=gitlab-ce
           Subject Public Key Info:
               Public Key Algorithm: rsaEncryption
                   Public-Key: (2048 bit)
                   Modulus:
                       00:c8:92:af:95:80:bd:9b:8f:0d:3e:2f:71:a9:14:
                       94:53:cd:cb:ea:ed:fa:ba:e5:2d:b1:61:ef:cf:86:
                       12:69:01:89:82:d7:e6:84:6f:69:16:d8:6f:7a:86:
                       2b:e7:34:78:02:f5:07:34:6b:19:1e:d7:82:c6:c2:
                       a8:1f:da:e0:2b:fa:59:6a:54:97:94:eb:5c:f7:47:
                       00:5c:68:a2:1d:85:56:d8:36:79:f7:d3:e1:65:51:
                       83:5e:12:9e:d6:65:b7:df:08:a5:b0:6a:45:07:19:
                       30:b8:c0:ab:13:6c:a0:99:92:17:78:97:5c:23:25:
                       0e:b5:07:1b:78:31:a3:59:36:72:0c:dd:42:d4:b3:
                       28:79:12:c7:92:37:bd:3f:6c:15:54:7f:4c:4d:a0:
                       03:6e:45:85:ed:c1:20:41:af:13:4e:40:5e:c1:3d:
                       1f:44:39:5d:fc:56:5c:79:10:22:31:d0:71:5e:1c:
                       41:6e:86:ca:58:60:65:30:f8:d5:da:87:fc:93:20:
                       0c:e5:c8:90:58:eb:62:0d:3a:ba:5e:4f:42:d7:e8:
                       5d:df:66:c3:3a:f9:a4:db:0b:86:25:f1:9e:de:1d:
                       72:c1:7a:04:c6:55:42:31:9f:f8:74:ff:13:31:79:
                       ba:52:63:a1:01:d4:1f:fd:38:ce:0a:0c:23:28:11:
                       04:e3
                   Exponent: 65537 (0x10001)
           X509v3 extensions:
               X509v3 Key Usage:
                   Digital Signature, Non Repudiation, Key Encipherment
               X509v3 Extended Key Usage:
                   TLS Web Server Authentication
               X509v3 Subject Alternative Name:
                   DNS:gitlab-ce, DNS:gitlab-ce.example.local
       Signature Algorithm: sha256WithRSAEncryption
            3c:c6:17:da:d3:9d:f8:7d:38:ea:cd:b2:b1:92:6f:3e:82:46:
            e4:77:aa:02:6a:7e:a2:5e:f2:9a:42:4c:ae:c7:86:41:a4:9a:
            73:65:e5:c0:ae:5b:36:f9:4a:c8:62:0b:ad:3b:ae:10:e4:60:
            02:20:a4:4f:35:ec:5e:35:7e:23:da:aa:96:5c:71:63:b0:d7:
            da:c6:46:1d:dc:00:9b:f1:97:bb:a1:1e:54:aa:1c:76:13:7f:
            3b:28:5a:ef:94:4e:c4:37:ca:bd:3e:6e:2e:13:8b:cb:f2:f7:
            5b:13:53:bf:e6:82:4c:48:38:95:bb:c5:3b:4c:54:13:6f:9b:
            fd:f6:4e:e2:a8:c2:7e:46:2b:0f:de:aa:0d:21:af:db:3f:84:
            5e:94:24:4b:ea:ed:99:f6:29:e1:1d:00:b3:75:61:fa:8b:8c:
            bf:29:6e:35:e5:e0:6e:b6:4f:44:de:f5:12:0a:19:d7:2a:8d:
            02:29:10:b6:79:9d:77:6c:7e:d3:1d:1a:4d:a0:0a:3b:06:54:
            4c:cb:62:e2:15:dc:1b:7a:9a:ef:c7:8d:47:74:ec:2d:c9:b4:
            30:4d:9f:13:52:b5:a8:66:ce:59:63:f7:93:ee:6c:1b:d9:e3:
            50:a6:35:3a:59:29:05:80:c8:e9:24:a0:75:b3:32:4c:ef:60:
            50:0e:d7:50

Now you can copy your certs to whatever webserver you’re running.

Install xrdp on Red Hat 8

Screen Shot 2019-09-18 at 1.51.00 PM

Update The OS

Check to see outstanding updates:

sudo yum check-update


Install and update the OS and all dependencies

sudo yum update -y


Add the Enterprise Linux Repository

RedHat 8

sudo rpm -Uvh https://dl.fedoraproject.org/pub/epel/epel-release-latest-8.noarch.rpm

Install & Start xrdp

Install xrdp:

xrdp is an Open Source Remote desktop Protocol server

sudo yum -y install xrdp


Start the local xrdp service

sudo systemctl start xrdp.service


Check to see if it’s running:

netstat -an | grep 3389


Check if its running, and add xrdp to autostart

sudo systemctl enable xrdp.service


Open the port and reload the firewall:

sudo firewall-cmd --add-port=3389/tcp --permanent
sudo firewall-cmd --reload


Test connecting with an RDP client


Put it all together

A basic script to run on new machines to enable RDP.

Create a script:

nano install_xrdp.sh


Paste in the below connects and save the file:

#!/usr/bin/bash

# Add Enterprise Linux Repository
rpm -Uvh https://dl.fedoraproject.org/pub/epel/epel-release-latest-8.noarch.rpm

# Install xrdp
yum -y install xrdp

# Start xrdp and enable at startup
systemctl start xrdp.service
systemctl enable xrdp.service

# allow port 3389 through firewall and reload rules
firewall-cmd --add-port=3389/tcp --permanent
firewall-cmd --reload


Make the file executable and run it:

sudo chmod +x install_xrdp.sh
./install_xrdp.sh

Setup Grafana, Influxdb, and Telegraf on Ubuntu 18.04

There’s great how-tos out there, like this and this. This is just the striped down steps that worked for me. I’m not a expert in any of these services.

Overview:

Assuming you already have an Ubuntu VM/box setup and configured how you want.

  • Install & Configure Influxdb
  • Install & Configure Telegraf
  • Install & Configure Grafana
  • Configure SSL With Self-Signed Certs For Grafana
  • Setup Influxdb With Self-Signed Certs

Install & Configure Influxdb
See documentation for changes or newer versions.

Default config file: /etc/influxdb/influxdb.conf

Install influxdb 1.7.3 (current version at the time), and set as a service to start at boot:

wget https://dl.influxdata.com/influxdb/releases/influxdb_1.7.3_amd64.deb
sudo dpkg -i influxdb_1.7.3_amd64.deb
sudo systemctl start influxdb
sudo systemctl enable influxdb

create the default influxdb database and user:

create database telegraf
create user telegraf with password 'password'
GRANT ALL ON telegraf TO telegraf

Set a retention policy name “Two_Weeks” for db telegraf, set it to 14 days and make it the default policy:

CREATE RETENTION POLICY Two_Weeks ON telegraf DURATION 14d REPLICATION 1 DEFAULT

Sanity checks to show that the db, user, and retention policy were created:

show databases
show users
SHOW RETENTION POLICIES ON telegraf

Install & Configure Telegraf

See documentation for changes or newer versions.
Default config file: /etc/telegraf/telegraf.conf

Install Telegraf 1.9.2 (current version at the time), and start as a network service at boot:

wget https://dl.influxdata.com/telegraf/releases/telegraf_1.9.2-1_amd64.deb
sudo dpkg -i telegraf_1.9.2-1_amd64.deb
sudo systemctl start telegraf
sudo systemctl enable telegraf
Create Telegraf Configuration File

If /etc/telegraf/telegraf.conf already exist make sure at least these options are uncommented and updated to your appropriate settings. Other wise create the file and paste these settings in.

[agent]
hostname = "nameofyourgrafanaserver"
flush_interval = "15s"
interval = "15s"

[[inputs.cpu]]

[[inputs.mem]]

[[inputs.system]]

[[inputs.disk]]
mount_points = ["/"]

[[inputs.processes]]

[[inputs.net]]
fieldpass = [ "bytes_*" ]

[[outputs.influxdb]]
database = "telegraf"
urls = [ "http://127.0.0.1:8086" ]
username = "telegraf"
password = "password"

After updating the config file, always restart Telegraf:

sudo systemctl restart telegraf

To test that Telegraf is setup correct:

#path_to_telegraf -test -config /path_to_telegraf.conf
telegraf -test -config /etc/telegraf/telegraf.conf

Install & Configure Grafana

See documentation for changes or newer versions.

Default config file: /etc/grafana/grafana.ini

Default log file: /var/log/grafana

Install Grafana 5.4.3 (current version at the time), and set as a network service at boot.

wget https://dl.grafana.com/oss/release/grafana_5.4.3_amd64.deb
sudo apt-get install -y adduser libfontconfig
sudo dpkg -i grafana_5.4.3_amd64.deb
sudo systemctl daemon-reload
sudo systemctl start grafana-server
sudo systemctl status grafana-server
sudo systemctl enable grafana-server.service

Logging in for the first time:

To run Grafana open your browser and go to http://localhost:3000/. 3000 is the default http port that Grafana listens to if you haven’t configured a different port. The defaults login ia admin/admin

Configure SSL With Self-Signed Certs For Grafana

Steps to enable SSL for Grafana. Change to the grafana config directory and create certs:

cd /etc/grafana
sudo openssl req -x509 -newkey rsa:2048 -keyout grafana-key.pem -out grafana-cert.pem -days 3650 -nodes

After creating the .pem files. Change the mode and owner:

sudo chmod 644 grafana-key.pem
sudo chmod 644 grafana-cert.pem
sudo chown root grafana-key.pem
sudo chown root grafana-cert.pem

Update /etc/grafana/grafana.ini with these options:

# Protocol (http, https, socket)
protocol = https

# https certs & key file
cert_file =/etc/grafana/grafana-cert.pem
cert_key =/etc/grafana/grafana-key.pem

Restart Grafana:

systemctl restart grafana-server

You should be able to access Grafana on https://localhost:3000/

Setup Influxdb With Self-Signed Certs:

Create the certs:

sudo openssl req -x509 -nodes -newkey rsa:2048 -keyout /etc/ssl/influxdb-selfsigned.key -out /etc/ssl/influxdb-selfsigned.crt -days 3650

After creating the .pem files. Change the mode and owner:

sudo chmod 644 /etc/ssl/influxdb-selfsigned.crt
sudo chmod 644 /etc/ssl/influxdb-selfsigned.key
sudo chown root /etc/ssl/influxdb-selfsigned.crt
sudo chown root /etc/ssl/influxdb-selfsigned.key

Update the influxdb.conf file:

[http]

#Determines whether HTTPS is enabled.
https-enabled = true

#The SSL certificate to use when HTTPS is enabled.
https-certificate = "/etc/ssl/influxdb-selfsigned.crt"

#Use a separate private key location.
https-private-key = "/etc/ssl/influxdb-selfsigned.key"

Restart influxdb:

sudo systemctl restart influxdb

You also need to update Telegraf so it knows to use ssl when sending to influxdb. Update the telegraf.config file.

sudo nano /etc/telegraf/telegraf.conf

Update these settings:

[[outputs.influxdb]]
urls = ["https://127.0.0.1:8086"]

## Optional TLS Config for use on HTTP connections.
insecure_skip_verify = true

## HTTP Basic Auth
username = "telegraf"
password = "password"

Log into Grafana web and update the Influxdb datasoure:
– change URL to https://localhost:8086
– check box for Skip TLS Verify

That’s it. You should be able to create a new dashboard in Grafana and start adding panels with stats collected from Telegraf on the local Ubuntu machine.

Azure: Adding A Network Security Rule To An Existing Network Security Group

This has caused me a lot of pain, I hope it saves someone else.

One of the things I do after creating a new VM in Azure is add rules to the NSG. This can be mundane and error prone, especially if you have a lot of rules. It’s much easier to deploy your VM with the basic RDP rule and then add your custom rules later. It’s even easier if you can script it. I prefer to use Powershell and the the AZ module on macOS, that way I don’t have to switch computers.

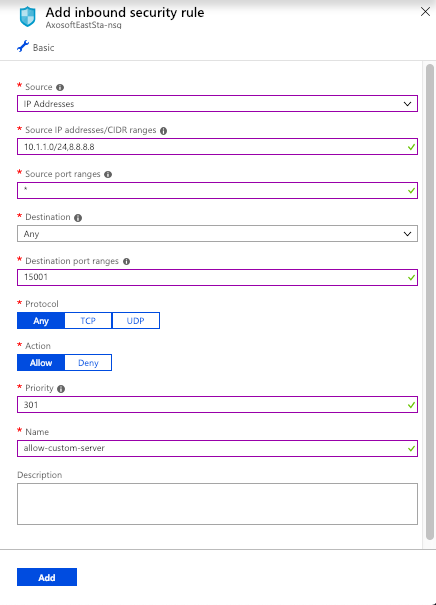
One of the issues I had was adding a NSG rule where “-SourceAddressPrefix” had multiple values. I can easily do this in the GUI by adding the rule manually.

(The IP addresses are just an example to show an IP address and a CIDR notation)

Screen Shot 2018-12-27 at 7.25.42 PM

If I click add here, I create a new rule. But I want to do this with Powershell. But every time I run my script, I get a 400 error on “SourceAddressPrefix”, telling me it’s a bad request. To make it worse, Microsoft doesn’t even offer an example in the official documentation of how to add more than 1 IP or CIDR value.

It took a lot of just trial and error, but I finally got it. If you’re passing more than 1 value to “-SourceAddressPrefix”, it expects that the “,” is NOT in quotations.

So where it feels natural to create a variable like this:

$officeWhiteList = "8.8.8.8,10.1.1.0/24"

It’s wrong. Your “,” is inside the quotes. If you change it to this:

$officeWhiteList = "8.8.8.8","10.1.1.0/24"

It works! Some simple documentation or better error messages would have saved me a ton of time. Here’s my full example to add a network security rule to an existing NSG:

#---------------------------------------------------------------------------
# Summary:
# Add an Azure Network Security Group Rule to an existing NSG

#---------------------------------------------------------------------------
$subscriptionToUse = "12345678-1234-1234-1234-123456789012" #just an example
$officeWhiteList = "8.8.8.8","10.1.1.0/25" #just an example
$rgName = "Resource-Group"
$nsgName = "Resource-Group-nsg"
$customServerRule = "allow-custom-server"
$customServerPort = 15001

# Select subscription ------------------------------------------------------
Set-AzureRmContext -SubscriptionId $subscriptionToUse

# Get the NSG resource -----------------------------------------------------
$resource = Get-AzureRmResource | Where-Object `
{$_.ResourceGroupName `
–eq $rgName `
-and $_.ResourceType `
-eq "Microsoft.Network/networkSecurityGroups"}

$nsg = Get-AzureRmNetworkSecurityGroup `
-Name $nsgName `
-ResourceGroupName $rgName

# Add customServerPort --------------------------------------------------------
$nsg | Add-AzureRmNetworkSecurityRuleConfig `
-Name $customServerRule `
-Description $customServerRule `
-Access Allow `
-Protocol * `
-Direction Inbound `
-Priority 301 `
-SourceAddressPrefix $officeWhiteList `
-SourcePortRange * `
-DestinationAddressPrefix * `
-DestinationPortRange $customServerPort

# Save changes to NSG ------------------------------------------------------
$nsg | Set-AzureRmNetworkSecurityGroup

If you want to add more than 1 rule, just add another “$nsg | Add-AzureRmNetworkSecurityRuleConfig” statement. When you’re done, make sure the last statement is “$nsg | Set-AzureRmNetworkSecurityGroup“, this saves your changes to the NSG

Bitbucket Server SSL Setup

Bitbucket SSL Setup

To secure Bitbucket server with a self-signed certificate, you’ll need to stop the server, generate a certificate, create a bitbucket.properties file, and restart the server.

This is for testing purposes only. In production, you should not use a self-signed certificate. And I’m assuming Bitbucket server is already running http on the default port 7990 on Ubuntu 18.04 LTS.

Stop bitbucket server:

sudo service atlbitbucket stop

Generate SSL keystore:
If you do not have Java installed, you must first install and verify you have the keytool command

#install Java
sudo apt-get install oracle-java8-installer

Verify keytool:

which keytool

Generate a self-signed certificate:

sudo keytool -genkey -alias tomcat -keyalg RSA -sigalg SHA256withRSA \
-keystore /var/atlassian/application-data/bitbucket/shared/config/ssl-keystore

Answers to the certificate creation … Note “What is your first and last name?” is the “Common Name” and should be the server name. Also the default password for tomcat is “changeit” … for testing purposes, it’s easiest to just use it as the default password.

Enter keystore password: changeit
Re-enter new password: changeit
What is your first and last name?
What is the name of your organizational unit?
What is the name of your organization?
What is the name of your City or Locality?
What is the name of your State or Province?
What is the two-letter country code for this unit?
Is CN=bitbucket-gk, OU=testco, O=testco, L=Phoenix, ST=Arizona, C=AZ correct?
Ignore the Warning:

The JKS keystore uses a proprietary format”.

There is No need to convert in dev environment. But you can convert it to “PKCS12”, but you have to add an additional line to your bitbucket.properties files:

server.ssl.key-store-type=pkcs12


Create bitbucket.properties file:

This file does not exist by default. If it’s missing, you must create it.

sudo nano /var/atlassian/application-data/bitbucket/shared/bitbucket.properties

Paste these into the bitbucket.properties file and save:

#ssl settings
server.port=8443
server.ssl.enabled=true
server.ssl.key-store=/var/atlassian/application-data/bitbucket/shared/config/ssl-keystore
server.ssl.key-store-password=changeit
server.ssl.key-password=changeit

To start bitbucket server:

sudo service atlbitbucket start

Wait about 3-5 minutes for the server to restart and access it on https://localhost:8443


To Export Out Certificate

If you want to export out the Java Keystore to a public .cer, and import into macOS keychain.

keytool -export -alias tomcat -file /tmp/bitbucket-gk.cer \
-keystore /var/atlassian/application-data/bitbucket/shared/config/ssl-keystore

Copy to local machine:

scp -rp ssh username@bitbucket-gk:/tmp/bitbucket-gk.cer /tmp

Once it’s copied to local machine you can double click the .cer to open the “Add Certificates” dialog box and import it into your local keychain. Once it’s imported, you can change the trust level to “Always Trust”.