Category Archives: Uncategorized

JamfReports Ruby Gem

Ruby Gem for Jamf Pro API

JamfReports is a ruby gem that uses the Jamf Pro API for hosted instances. Currently, it only reports on Applications. Pulling from the /api/v1/computers-inventory?section=APPLICATIONS endpoint.

For gem install instructions see here

*Future reports may be added.


Usage

In order to run JamfReports, you are required to add these two lines to the top of your file, under the require JamfReports line

#!/usr/bin/ruby
require "JamfReports"

## UPDATE THESE VARIABLES -------------------------------
$jamfpro_url = "https://company.jamfcloud.com" 
$api_pw = "Your API KEY HERE"

If you don’t have your api key for the $api_pw variable, run this command to create it and paste it into the variable.

printf "jamfUserName:JamfPassword" | iconv -t ISO-8859-1 | base64 -i -

And these 3 lines to generate the api token and pull the data from Jamf so you can run the report commands.

JamfReports.getToken
JamfReports.checkTokenExpiration
JamfReports.getAllApplicationInventory

A full working file might look like this.

#!/usr/bin/ruby
require "JamfReports"

## UPDATE THESE VARIABLES ----------------------------------------
$jamfpro_url = "https://company.jamfcloud.com" 
$api_pw = "Your API KEY HERE"

## COMMANDS ------------------------------------------------------
JamfReports.getToken
JamfReports.checkTokenExpiration
JamfReports.getAllApplicationInventory

## REPORTS -------------------------------------------------------
JamfReports.listAllInstalledApps
# JamfReports.webBrowserReport
# JamfReports.totalNumberOfOneInstalledApps
# JamfReports.listofOneInstallApps

## After reporting, revoke current token
JamfReports.invalidateToken

Examples

listAllInstalledApps

Returns a sorted list of all apps installed across your fleet of computers in Jamf. Sorted from most installed app, to least.

webBrowserReport

  • Google Chrome.app
  • Google Chrome Canary.app
  • Firefox.app
  • Firefox Developer Edition.app
  • Safari.app
  • Safari Technology Preview.app
  • Microsoft Edge.app
  • Brave Browser.app
  • Arc.app
  • Opera.app
  • LinCastor Browser.app
  • LockDown Browser.app
  • Tor Browser.app
  • Vivaldi.app
  • DuckDuckGo.app

totalNumberOfOneInstalledApps
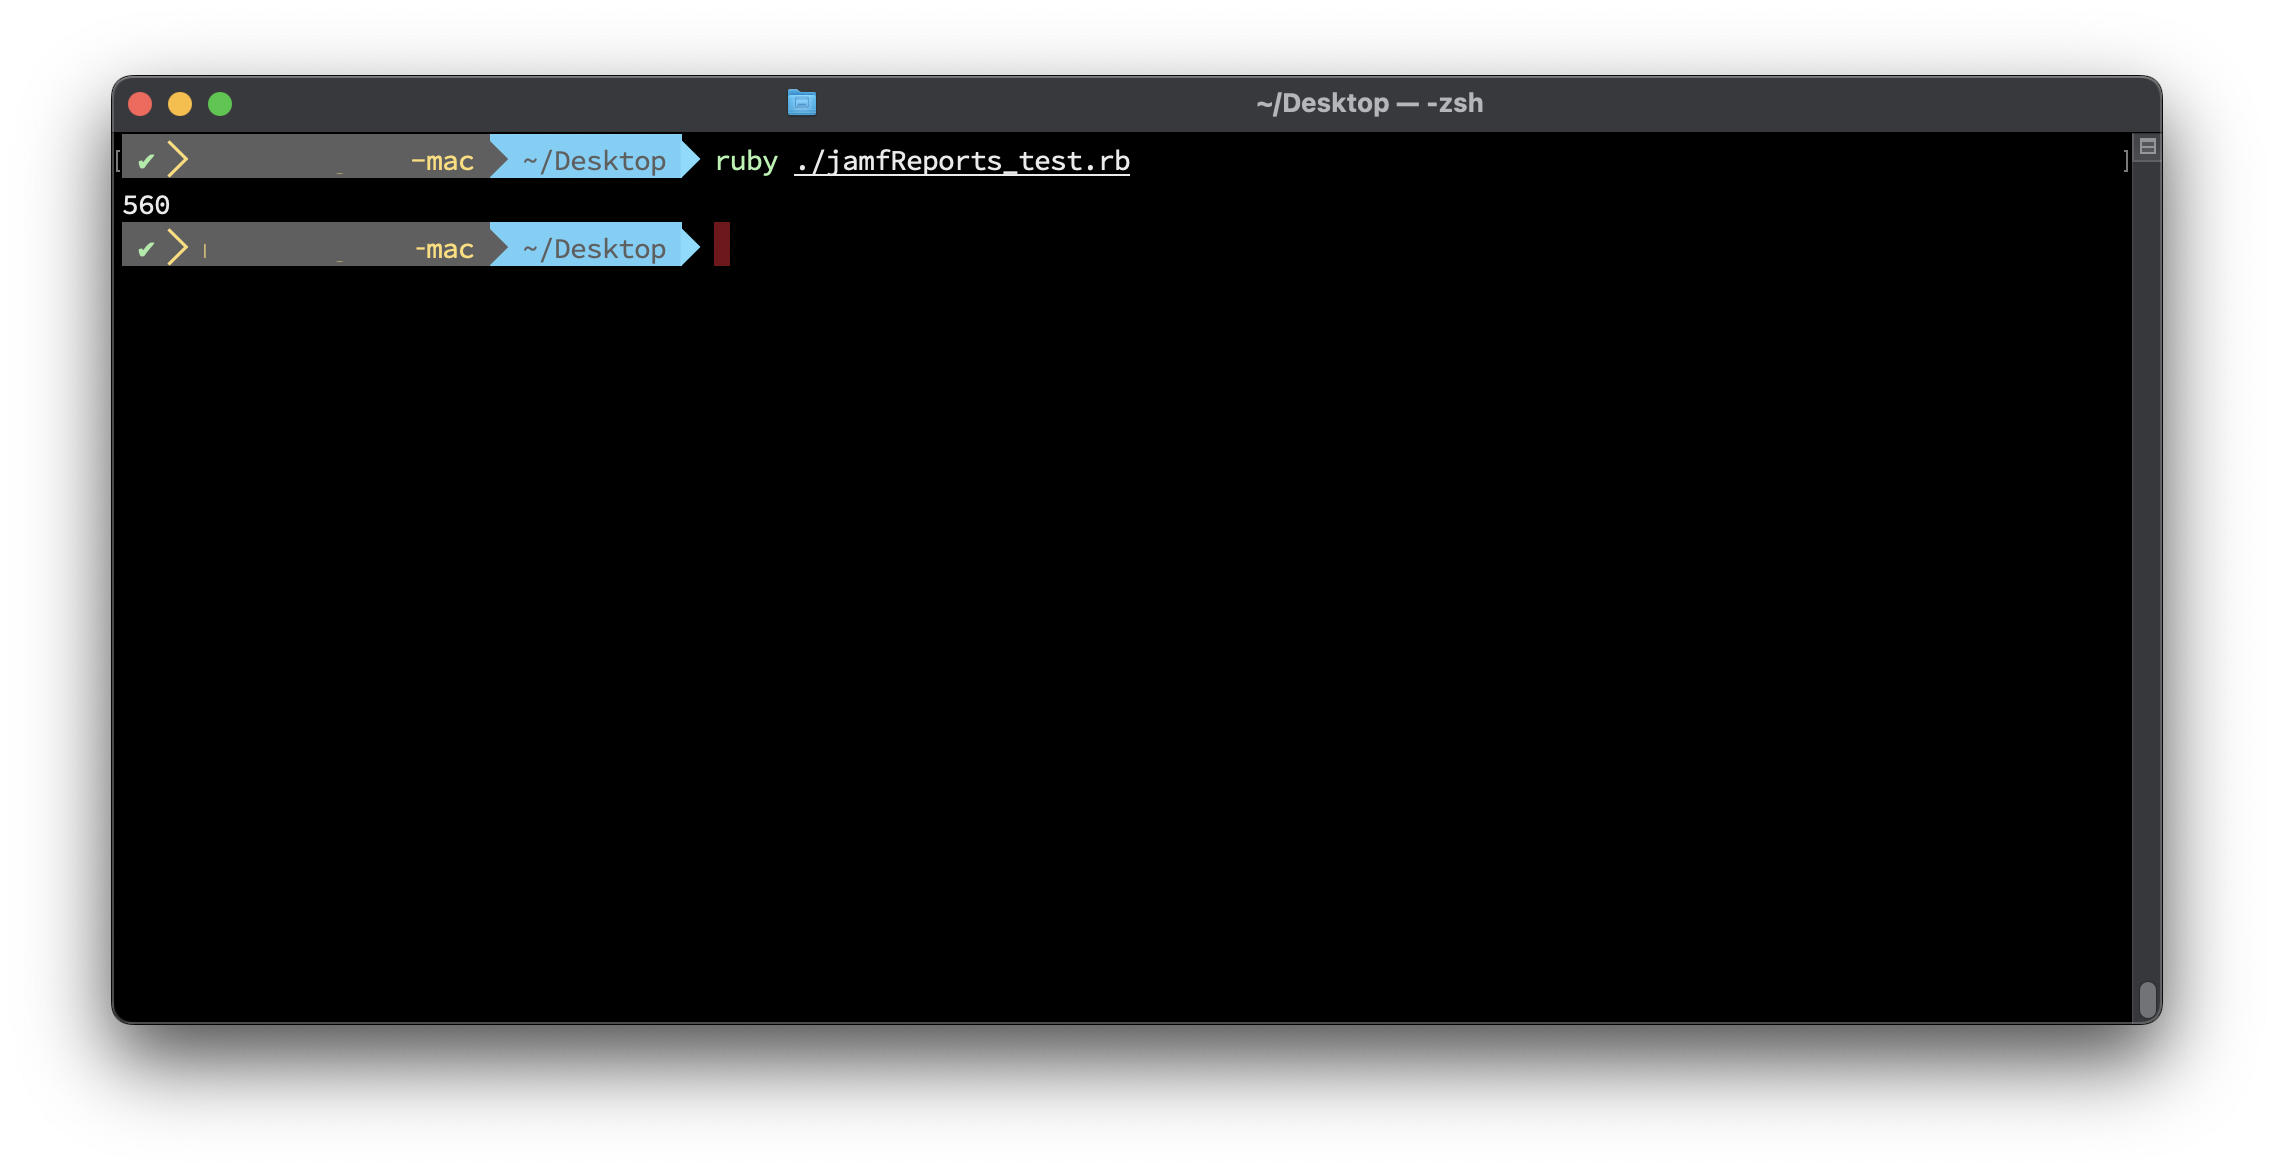
Returns a single metric to show the number of “One-off” or single installed apps across your fleet.

listofOneInstallApps
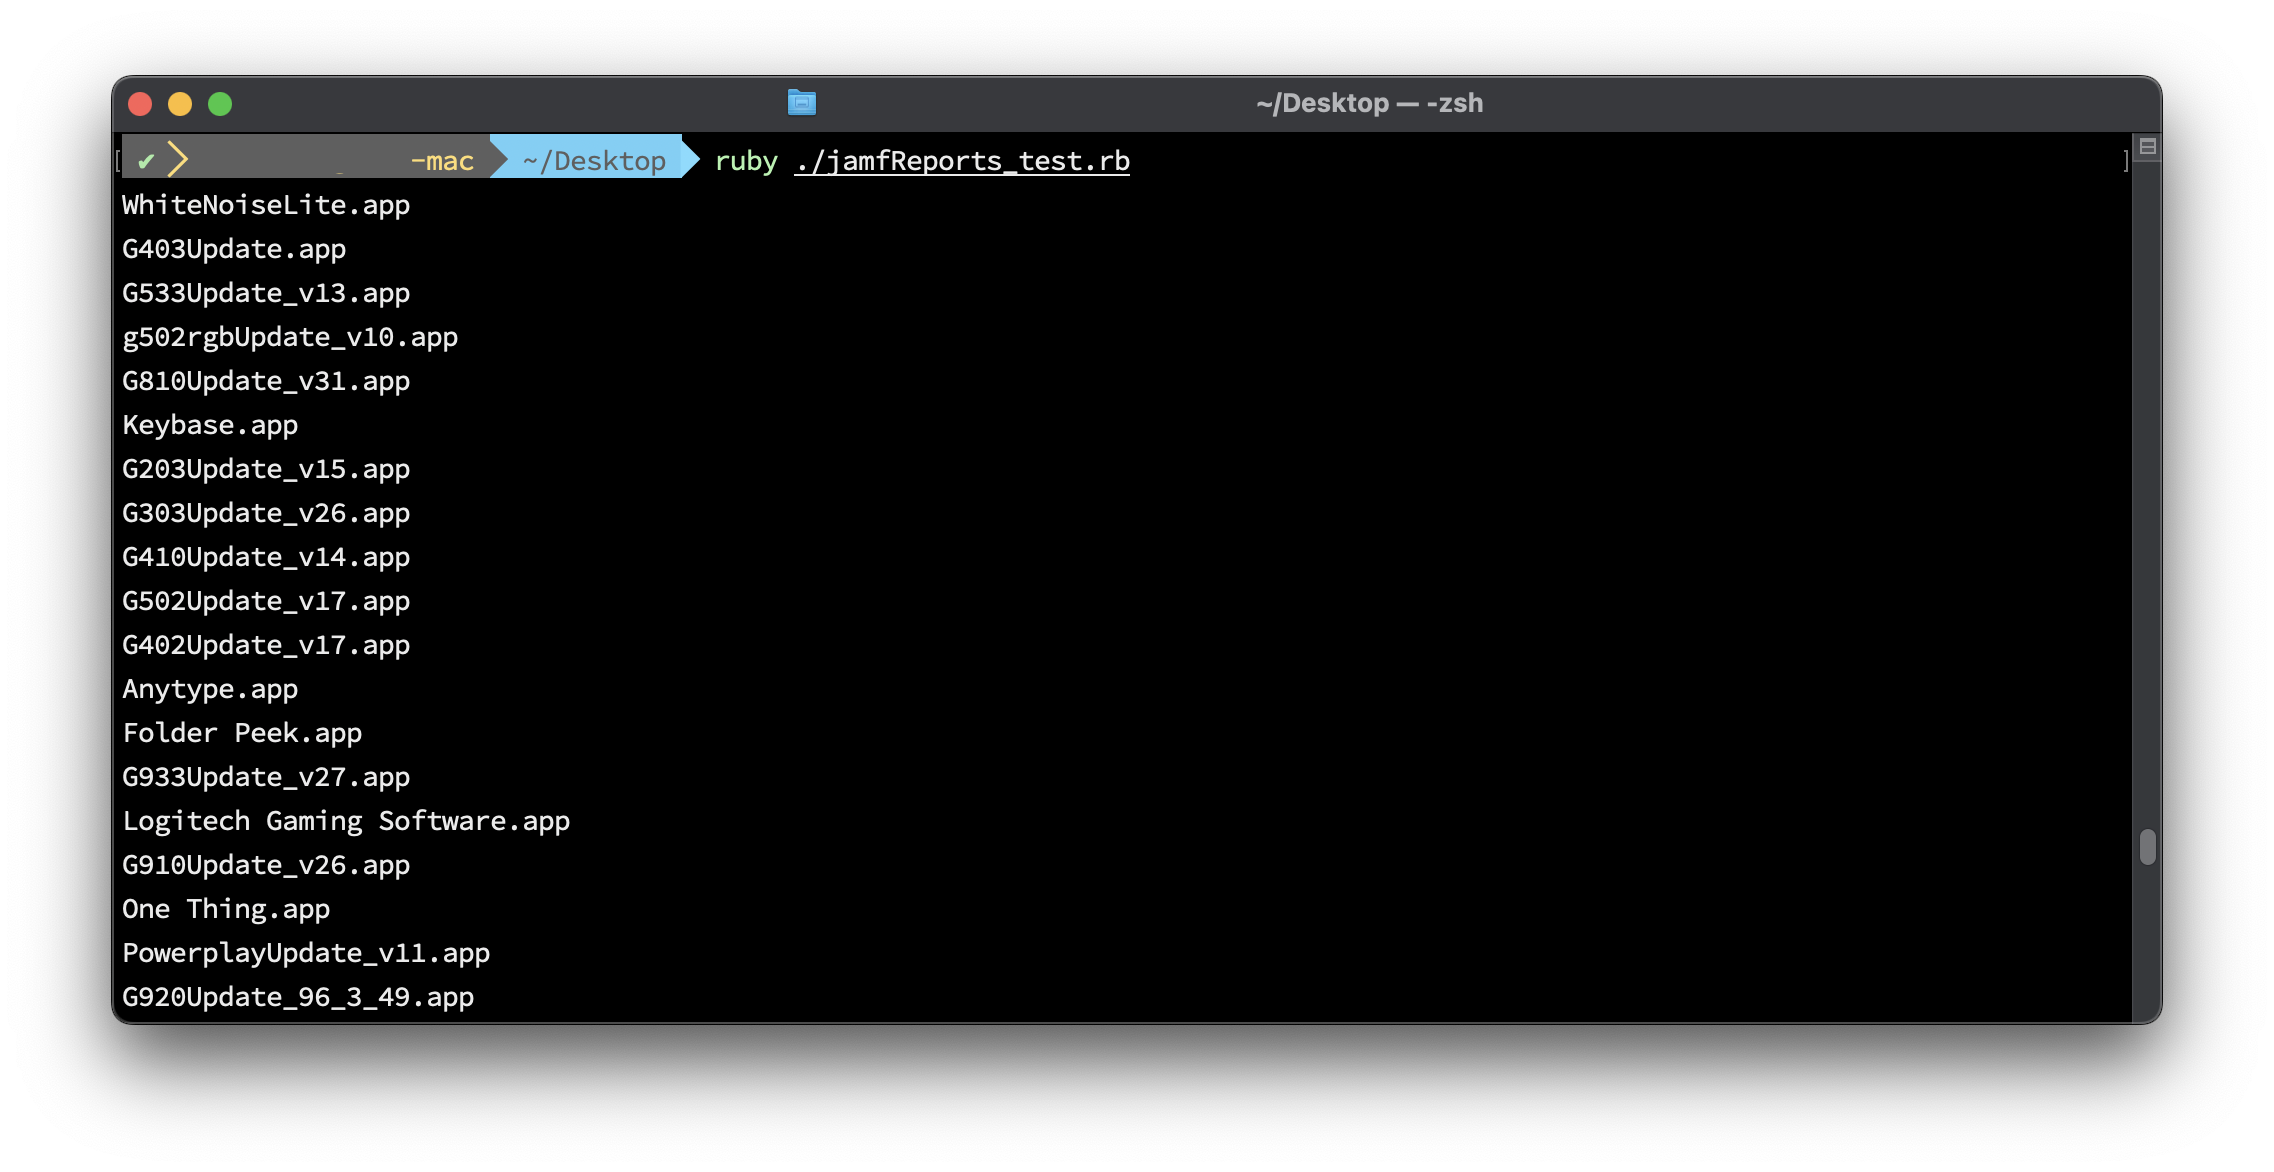
Returns a list of all the “One-off” or single installed apps across your fleet. This can be helpful in scoping in Jamf uninstall policies.

macOS: Enable Chrome Auto Updates For All Users

Meant to be run after installing Chrome for the first time on a machine to enable auto updates for all users. Creates the /Library/Google/GoogleSoftwareUpdate folder, including “TicketStore“. Then registers the system for autoupdates.

Before running, /Library/Google/GoogleSoftwareUpdate doesn’t exist


Run the script with Sudo to install to the system wide location at /Library/Google instead of the user location at ~/Library/Google.

 sudo chrome_enable_autoupdates.rb

After running, the folder and ticket store are created


. To check settings after running:

  • Open Chrome
  • Click on Chrome in upper left menu bar
  • Click on “About Google Chrome“
  • Check update settings

The bulk of the work is done by the KSADMIN command to register a keystone ticket and check for updates. Full script can be found here.

  def self.keystone_register
          command = [
             "'#{KSADMIN}'",
             "--register",
             "--productid",          "'#{product_id}'",
             "--version",            "'#{chrome_version}'",
             "--xcpath",             "'#{CHROMEPATH}'",
             "--url",                "'#{update_url}'",
             "--tag-path",           "'#{TAGPATH}'",
             "--tag-key",            "'#{TAGKEY}'",
             "--brand-path",         "'#{BRANDPATH}'",
             "--brand-key",          "'#{BRANDKEY}'",
             "--version-path",       "'#{VERSIONPATH}'",
             "--version-key",        "'#{VERSIONKEY}'",
       "--system-store",
             "2>/dev/null"]
          system("#{command.join(" ")}")
     end

Jenkins Build Scripts For macOS 12 Monterey

I automate part of my macOS builds for new OS releases. I use a simple script (_version_check.sh) that I update with the latest release, ie … 12.2.1. Then I commit it to my repo and fire a webhook to Jenkins. Jenkins takes the version number and checks to see if it’s available via the "softwareupdate" command.

softwareupdate --fetch-full-installer --full-installer-version "$version_to_download"

If it is, it downloads the full installer app, “Install macOS Monterey.app“, to the Applications folder. When that is successful, I have a second Jenkins job that converts the “.app" to a “.dmg" . I archive the “.dmg" and use it in automated workflows with tools like MDS

Scripts are on Github

Showing Bluetooth Battery Percentage On Your Desktop

I use a tool called GeekTool (a fun tool that can be used in a lot of ways) to show the battery percentage of my bluetooth connected devices on my desktop. It makes it easier to keep an eye on them and know when they need charged.

Since switching to an Apple M1 laptop my old script broke, so I took a little time to update it. I used to pull the information from system_profiler but it seems it’s been removed. the ioreg command, now list the current battery percentage of any bluetooth connected devices

ioreg -r -l -k "BatteryPercent"  

This might look like it gives you a lot of output, but we really just need to parse it, to get what we want. The below command will give you current battery percentage for an Apple Magic Keyboard and Magic Mouse. Other products can be listed, but you’d have to run the above ioreg command and get the Product name to switch out in the command.

KeyboardPercent=$(ioreg -r -l -k "BatteryPercent" \
| grep -A 9 "Magic Keyboard with Touch ID" \
| grep "BatteryPercent" \
| awk '{print $3}')

MousePercent=$(ioreg -r -l -k "BatteryPercent" \
| grep -A 9 "Magic Mouse" \
| grep "BatteryPercent" \
| awk '{print $3}')

echo "Keyboard Battery Level: $KeyboardPercent"
echo "Mouse Battery Level: $MousePercent"

Once I have the command working, I update my GeekTool script. There’s a little more formatting here then just show me the percentage and GeekTool is more sensitive to whitespace. The below command is what I use to paste into the script editor to give me the output in the screenshot.

#!/bin/zsh

# Bluetooth Keyboard -----------------------------------------------------------
KeyboardPercent=$(ioreg -r -l -k "BatteryPercent" \
| grep -A 9 "Magic Keyboard with Touch ID" \
| grep "BatteryPercent" \
| awk '{print $3}')

typeset -i b=5
echo "Keyboard:\t\t\c"

if [ ${KeyboardPercent} = 0 ]
then
    echo "Disconnected\c"
else
    if [ $KeyboardPercent -lt 11 ]
    then
        echo "\033[1;31m\c"
    else
        echo "\033[0m\c"
    fi
    while [ $b -le $KeyboardPercent ]
    do
        echo "|\c"
        b=`expr $b + 5`
    done
    while [ $b -le 100 ]
    do
        echo "\033[1;37m|\033[0m\c"
        b=`expr $b + 5`
    done
    echo "\033[0m $KeyboardPercent%\c"
    unset KeyboardPercent
    unset b
fi

echo "\033[0m\nMouse:\t\t\t\c"

# Bluetooth Mouse --------------------------------------------------------------

MousePercent=$(ioreg -r -l -k "BatteryPercent" \
| grep -A 9 "Magic Mouse" \
| grep "BatteryPercent" \
| awk '{print $3}')

if [ ${MousePercent} = 0 ]
then
    echo "Disconnected\c"
else
    if [ $MousePercent -lt 11 ]
    then
        echo "\033[1;31m\c"
    else
        echo "\033[0m\c"
    fi
    typeset -i b=5
    while [ $b -le $MousePercent ]
    do
        echo "|\c"
        b=`expr $b + 5`
    done
    while [ $b -le 100 ]
    do
        echo "\033[1;37m|\033[0m\c"
        b=`expr $b + 5`
    done
    echo "\033[0m $MousePercent%\c"
    unset MousePercent
    unset b
fi

Scripts can be found here

Monitor Scheduled Tasks on Windows Server

Scheduled Tasks are a great way to run scripts at specified time intervals. Similar to Unix cron. Because it’s such a powerful tool, it can be easy to abuse by programs that install their own schedule tasks. Most times without any transparency to the user that a task is being created. It’s also a potential target for malware to install persistent tasks that go unnoticed.

On managed servers, I want transparency into which tasks are installed. I created a powershell script with an array of “whitelisted” tasks, then created a scheduled tasks to check the name of the scheduled tasks installed. The results are sent to InfluxDB and If a task is not on my white list, an alert is sent with Grafana.

The powershell script and scheduled task can be found here.

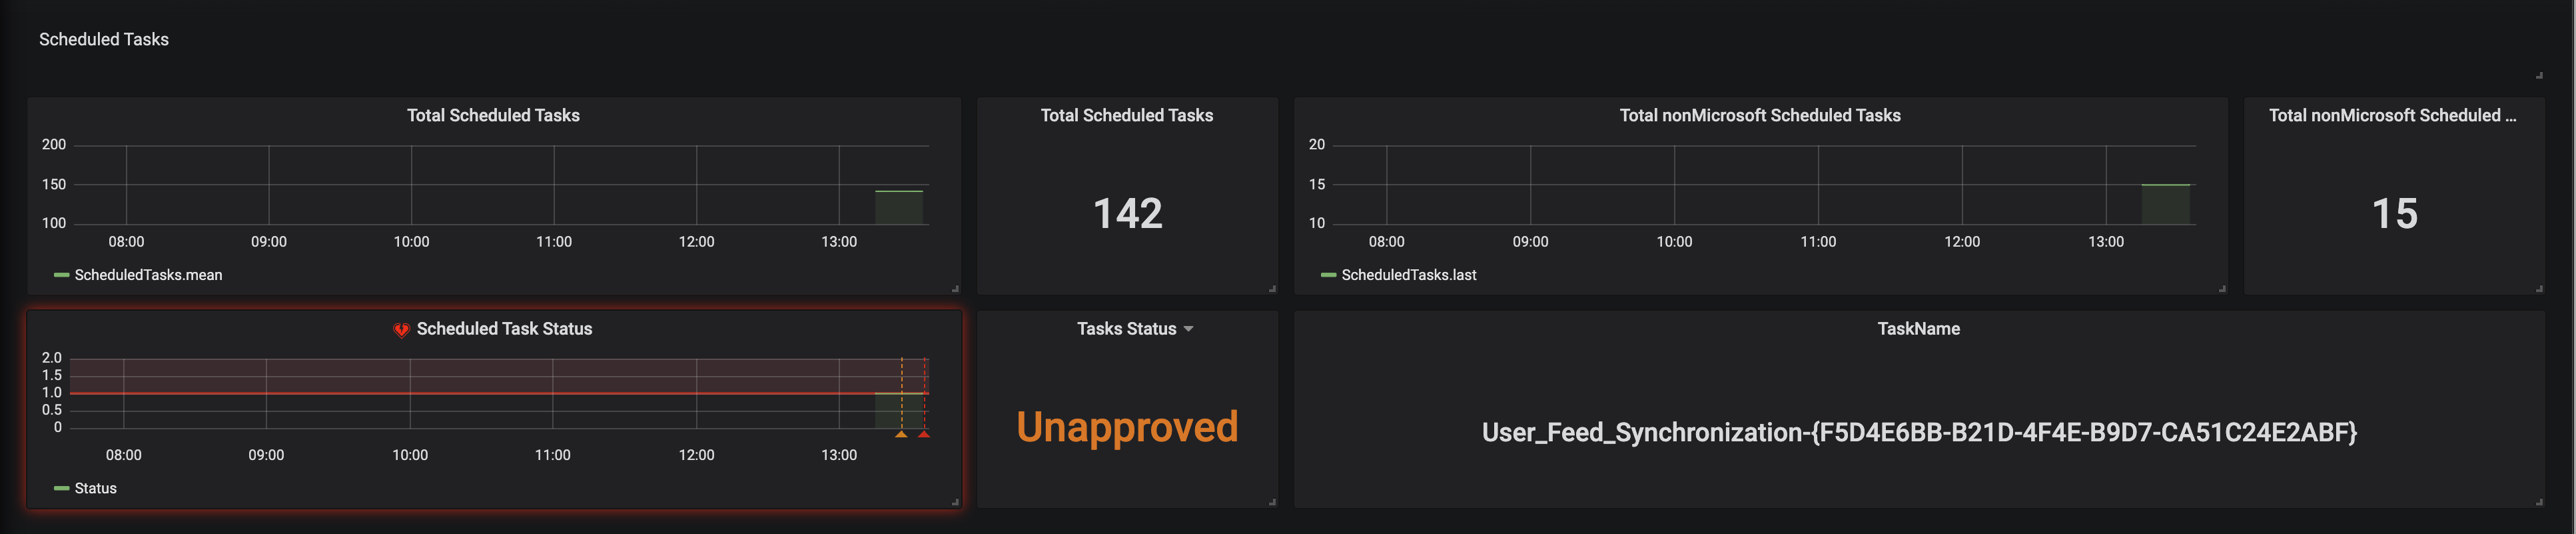
When first installed, it reports the total number of scheduled tasks, and total number of non-Microsoft tasks. By default, I ignore Microsoft tasks installed on a new install.

In this scenario you can see an alert has been triggered, because there is an Unapproved task, and to the right, it shows the name of the task, User_Feed_ ...

Now you can log into the computer and check the task to decided if it needs added to your white list or deleted.

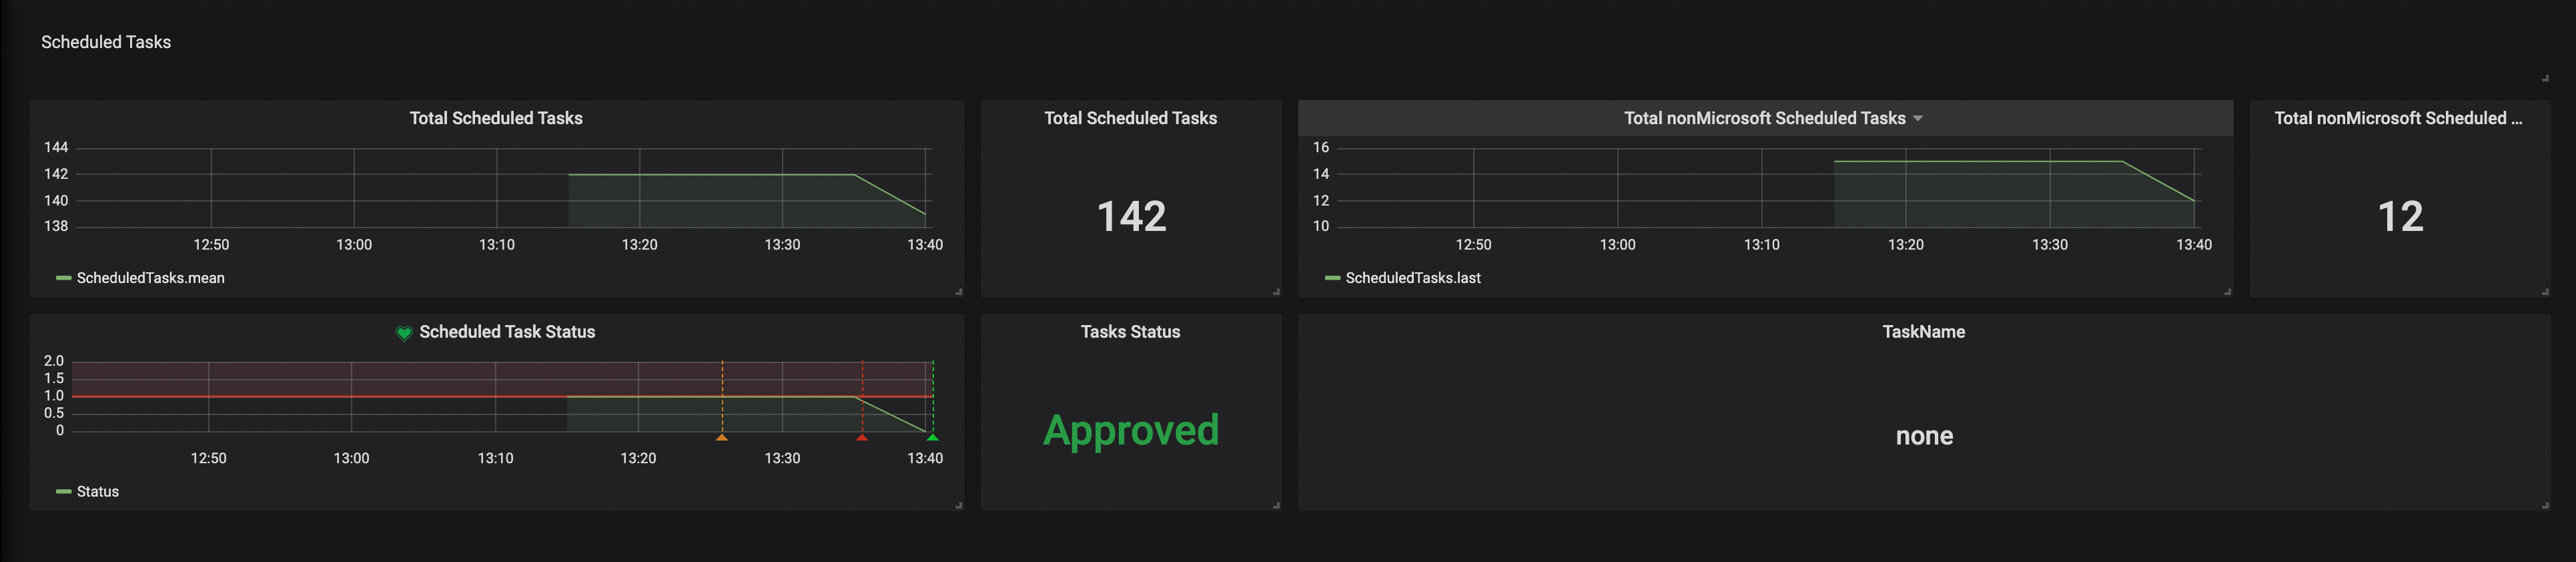
Once the task has been deleted, the alarm is cleared and all tasks report as Approved

Getting Windows Performance Counters Into InfluxDB and Grafana

I needed to get some Windows performance counters into InfluxDB, so I could setup some dashboards with Grafana. I’ve seen others post their default telegraf.conf files with the baseline CPU, Memory, Disk, etc … metrics. But I needed to track some non-default metrics. Like, “SQL Server Batch Requests/sec“. I started out writing my own powershell, parsing the data and sending an “Invoke-WebRequest” to my InfluxDB with Line Protocol data.

Then I realized, I could probably copy an existing “[[inputs.win_perf_counters.object]]“ from the default telegraf.conf file. Then dig into Windows Performance Monitor to find the exact metric I need, and just switch the “ObjectName” and “Counters” out.

This is my example with Batch Requests/sec

  • Open Windows Performance Monitor
  • Click the green “+" button to add a counter
  • Find the counter you want, in this case “SQLServer:SQL Statistics“
  • Click the “upside down arrow” to the right
  • Select “Batch Requests/sec“
  • Click the “Add” button
  • Click “OK” to close the window
  • Verify you get the metrics you want
  • Make a note of the “Counter“, “Instance“, and “Object” names
  • Open your “telegraf.conf” file
  • Under the “Inputs” sections, copy an existing “[[inputs.win_perf_counters.object]]” section
  • Update “ObjectName” with the “Object” from Windows Performance Monitor
  • Update “Counters“, with the “Counter” name from Windows Performance Monitor
  • Update “Instances” with the instance name from Windows Performance Monitor. In this case “*” to choose All, since there is no specific name
  • Update “Measurement” with a name for the collection you want to use in InfluxDB to store the metrics. For this example, “win_sql“
  • Login to Grafana and add a new panel
  • Select your measurement from the telegraf.conf file (win_sql)
  • Select the Counter from the telegraf.conf file ,in the field box (Batch Requests/sec)

Install xrdp on Red Hat 8

Screen Shot 2019-09-18 at 1.51.00 PM

Update The OS

Check to see outstanding updates:

sudo yum check-update


Install and update the OS and all dependencies

sudo yum update -y


Add the Enterprise Linux Repository

RedHat 8

sudo rpm -Uvh https://dl.fedoraproject.org/pub/epel/epel-release-latest-8.noarch.rpm

Install & Start xrdp

Install xrdp:

xrdp is an Open Source Remote desktop Protocol server

sudo yum -y install xrdp


Start the local xrdp service

sudo systemctl start xrdp.service


Check to see if it’s running:

netstat -an | grep 3389


Check if its running, and add xrdp to autostart

sudo systemctl enable xrdp.service


Open the port and reload the firewall:

sudo firewall-cmd --add-port=3389/tcp --permanent
sudo firewall-cmd --reload


Test connecting with an RDP client


Put it all together

A basic script to run on new machines to enable RDP.

Create a script:

nano install_xrdp.sh


Paste in the below connects and save the file:

#!/usr/bin/bash

# Add Enterprise Linux Repository
rpm -Uvh https://dl.fedoraproject.org/pub/epel/epel-release-latest-8.noarch.rpm

# Install xrdp
yum -y install xrdp

# Start xrdp and enable at startup
systemctl start xrdp.service
systemctl enable xrdp.service

# allow port 3389 through firewall and reload rules
firewall-cmd --add-port=3389/tcp --permanent
firewall-cmd --reload


Make the file executable and run it:

sudo chmod +x install_xrdp.sh
./install_xrdp.sh

Installing Certificates on macOS with Puppet

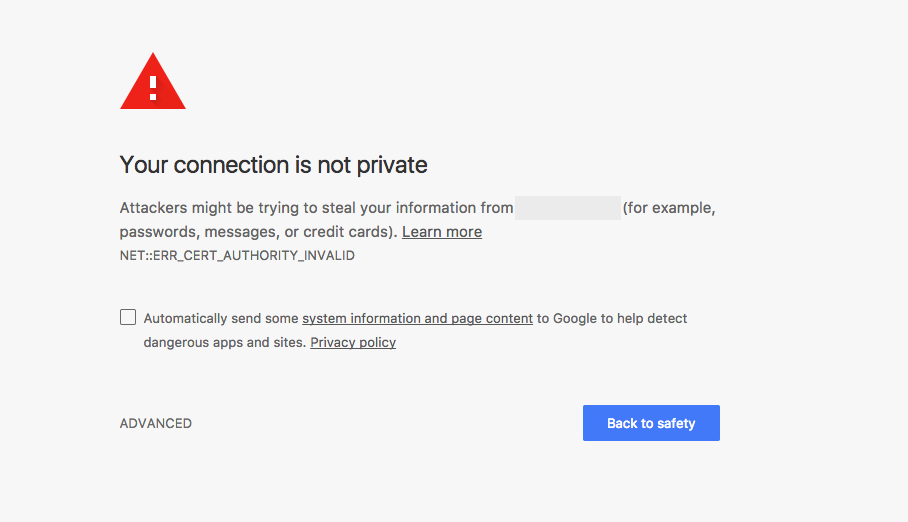
I have lots of internal web servers that use self signed certs for HTTPS encryption. Every time I try to login to theses server I get the “Your connection is not private” message.

Screen Shot 2017-10-13 at 6.41.26 PM.png

It’s not that it’s a big deal, but it’s annoying since I use multiple computers for admin work. Let’s get puppet to solve this problem.

I started with an external fact that I placed in my module, in the facts.d folder (you have to create this folder). It simply checks to see if I can find the certificate in the system keychain and sets a variable … either “cert_installed=true” or “cert_installed=false”.

#!/usr/bin/ruby
check_cert="security find-certificate -a server.company.edu.cer -k /Library/Keychains/System.keychain | grep \"server.company.edu\" >/dev/null"

if system(check_cert) == true
  puts "cert_installed=true"
else
  puts "cert_installed=false"
end

The in the manifest … I check if the cert is installed and if it’s false, I copy the cert to the /tmp folder and then run a command to install it and trust it.

 class cert {
	if $facts['cert_installed'] == 'false' {
		file { "/tmp/server.company.edu.cer":
			mode => "0777",
	  		owner => 'root',
		  	group => 'wheel',
		  	source => "puppet:///modules/cert/server.company.edu.cer",
		}
		exec { "server.company.edu.cer":
	  		command => 'sudo security add-trusted-cert -d -r trustAsRoot -k /Library/Keychains/System.keychain "/tmp/server.company.edu.cer"',
			path	=> ["/bin", "/usr/bin", "/sbin", "/usr/sbin"],
			require => File["/tmp/server.company.edu.cer"]
		}
	}
}

This has been working beautifully.

Install MatLab R2017a Network License, Silently on macOS Sierra

For any MacAdmins in higher Ed, this is how I’m packaging and deploying MatLab. Last year I didn’t have time and ended up manually installing on each machine in a lab. This year I have even more MatLab installs and realized it was time to do it right.


Login to your MatLab account and download the latest installer

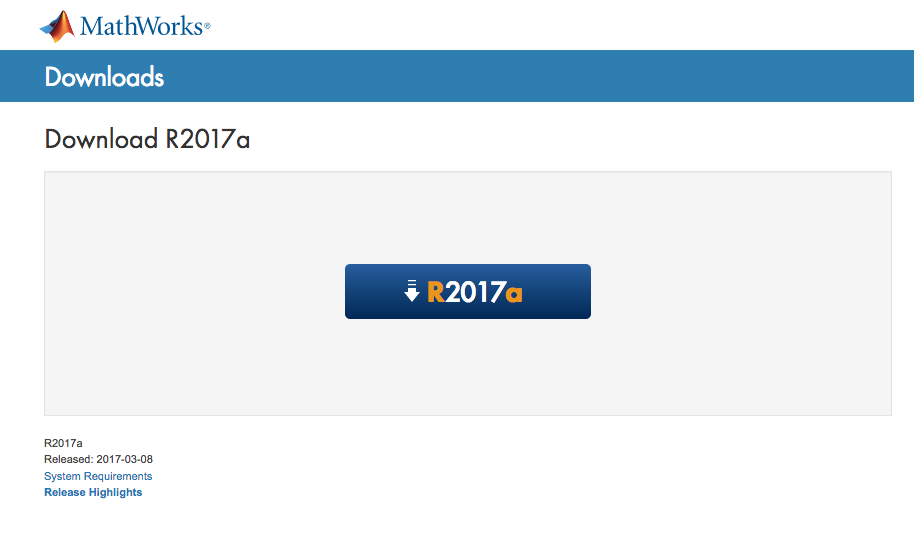
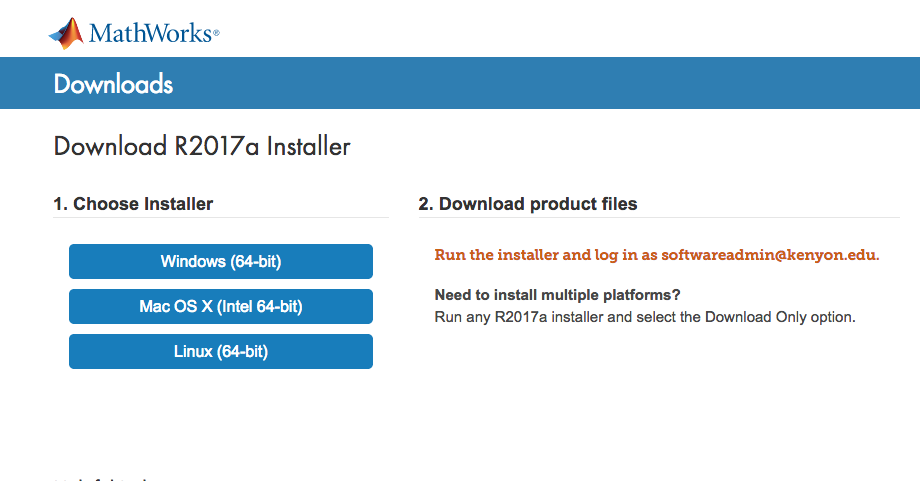
The first step is to log into your MatLab account and download the latest version .. R2017a.

matlab_2017_08.png

The click the download for the Mac OS X installer

matlab_2017_09.png

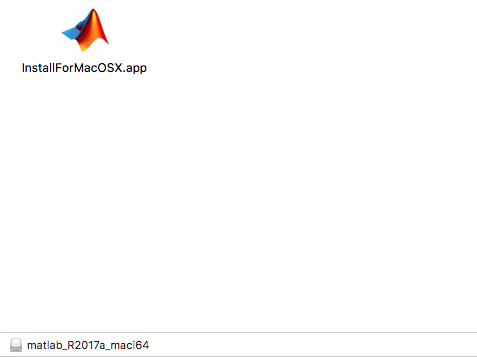
That downloads the file, “matlab_R2017a_maci64.dmg.zip”. Un-zip and then double click on the “matlab_R2017a_maci64.dmg”. Inside is “InstallForMacOSX.app”, double click to launch the installer.

matlab_2017_11.png


Create installer_input.txt File

Inside the folder downloaded by Matlab is a file named, “installer_input.txt”. Use this file to edit the options on how to install Matlab. You want to uncomment any options you want the installer to run. Basically here’s the options you want for a network install.


Download the files

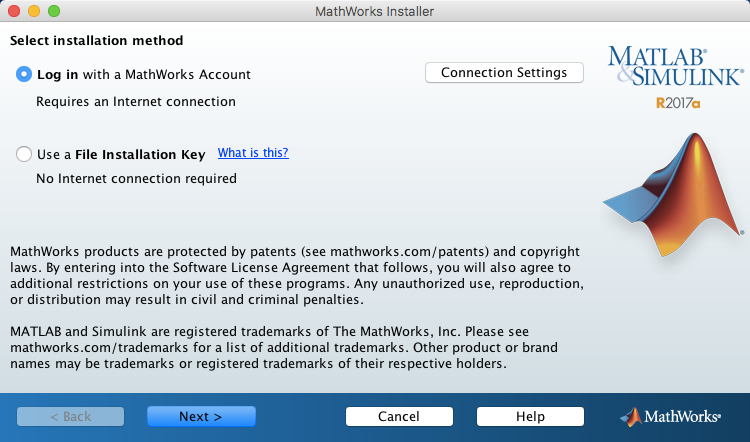
When the installer opens, select “Log in with a MathWorks Account”, click on  “Next”

matlab_2017_01.png

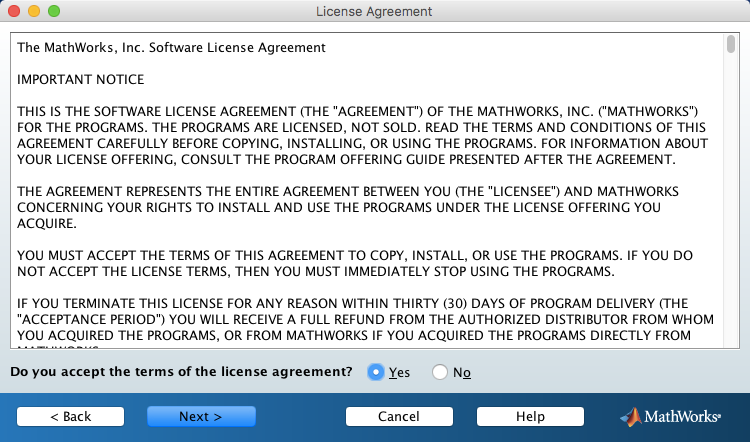
Accept the EULA, click on “Next”.

matlab_2017_02.png

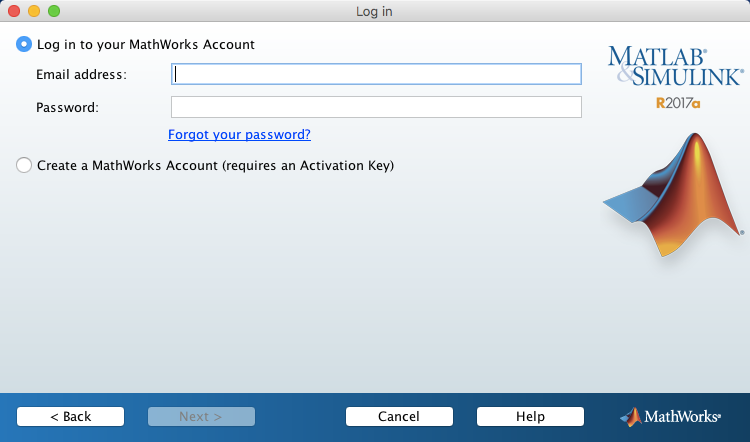
Select “Log in to your MathWorks Account”, and enter your email and password. Click on “Next”.

matlab_2017_03.png

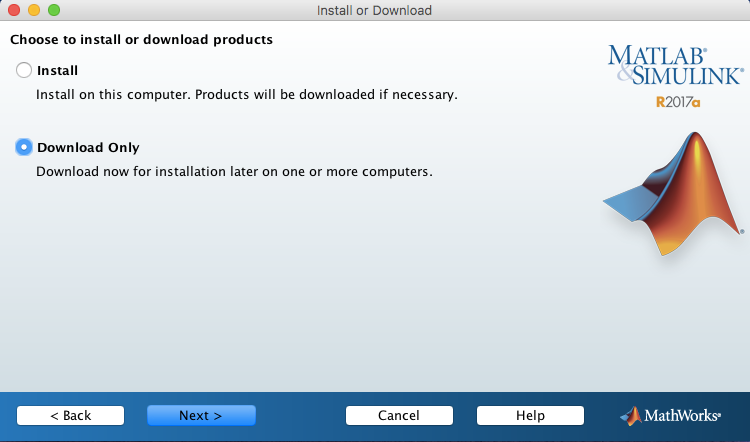
Select “Download Only”, click on “Next”.

matlab_2017_04.png

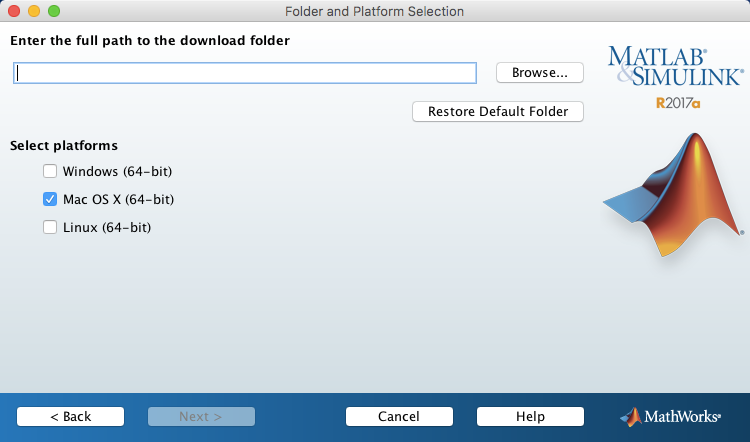
Browse to where you want to download the files. By default it will create “~/Downloads/MathWorks/R2017a”. Unless you have a reason to change it, the defaults work fine.

matlab_2017_05.png

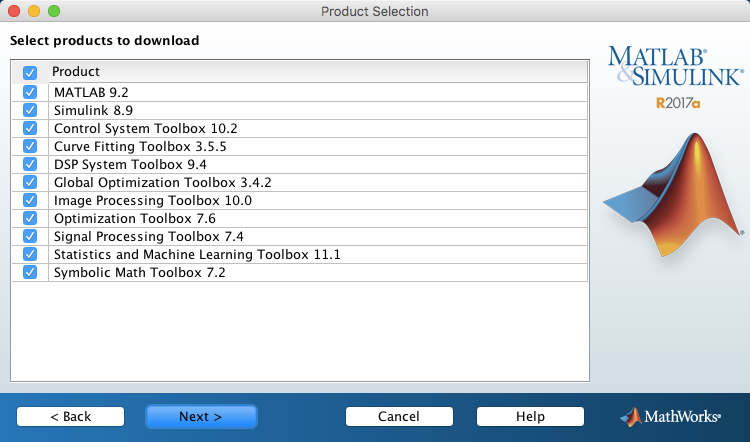
Select what products you want to download, click “Next”.

matlab_2017_06.png

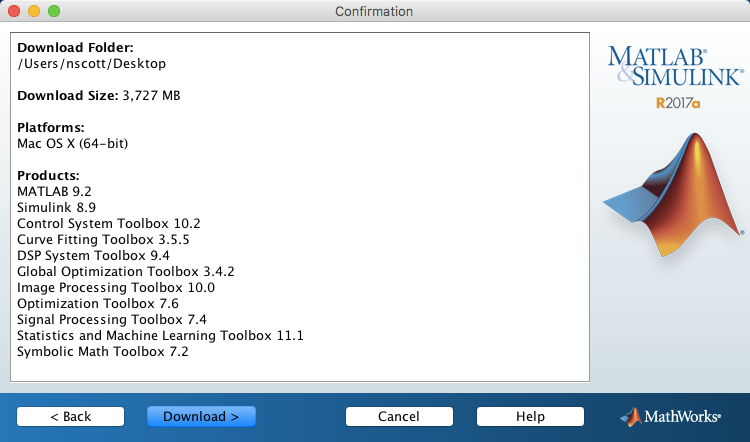
Review, and click “Download”.

matlab_2017_07.png


Edit “installer_input.txt” File

Inside the folder MatLab downloaded is the “installer_input.txt” file. This contains the options for how the installer installs MatLab. For a basic install of a network licensed client, here’s what you want to un-comment and edit in the file. You can also check out Graham Pugh’s file.

## SPECIFY INSTALLATION FOLDER
destinationFolder=/Applications

## SPECIFY FILE INSTALLATION KEY
fileInstallationKey=xxxxx-xxxxx-xxxxx-xxxxx-xxxxx

## ACCEPT LICENSE AGREEMENT
agreeToLicense=yes

## SPECIFY OUTPUT LOG
outputFile=/Library/Logs/matlab_r2017a.log

## SPECIFY INSTALLER MODE
mode=silent

## SPECIFY PATH TO LICENSE FILE (Required for network license types only)
licensePath=/Users/Shared/MatLab_2017a_License/license.dat

## CHOOSE TO INSTALL LICENSE MANAGER (For network license types only, on select true for the license server)
lmgrFiles=false

Repackage and Deploy

Once all the files are download, a little over 4 GB’s. You need to decide on how you’ll repackage and deploy them. You can use a management tool, or Apple Remote Desktop, or Whitebox – Packages to make a pkg, but I’m going to use munkipkg. If you’ve never used it, check out the site for examples and usage, it’s very simple and predictable.

To create a new project, run:

/path_to_munkipkg --create /path_to_project_folder

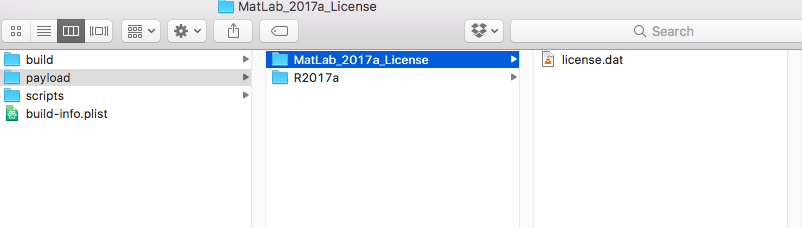
munkipkg will create the folder structure. Inside the payload folder , I put the R2017a folder with all the files downloaded from the installer. I created the “MatLab_2017a_License” folder, for the network license. I’m going to copy each folder to “/tmp”. Edit the “build-info.plist” file to change the install location to “/tmp”. Then I’ll create a postinstall script to copy the license folder to “/Users/Shared” and run the install. make sure you put the script in the “scripts” folder, named “postinstall” and make it executable.

Screen Shot 2017-06-03 at 5.31.21 PM.png
My postinstall script looks like this:

#!/bin/bash

#copy license folder to /Users/Shared
sudo mv /private/tmp/MatLab_2017a_License /Users/Shared

#run the MatLab installer and specficy an installer file for options
sudo /private/tmp/R2017a/install -inputFile /private/tmp/R2017a/installer_input.txt

Once you have all the pieces in place, you’re ready to make a package. Run the command below to have munkipkg create a pkg file in the “build” folder.

/path_to_munkipkg /path_to_project_folder

Deploy and Test

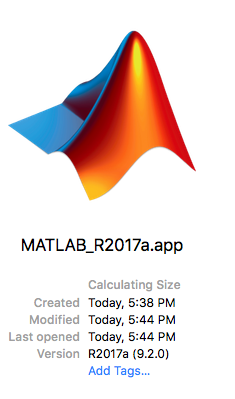
That’s it. Test the install package, for me that means adding it to a DeployStudio workflow. Edit whatever typos you made. If you did it right, you should end up with MatLab installed in the “/Applications” folder.

Screen Shot 2017-06-03 at 6.07.42 PM.png