Monthly Archives: January 2022

Monitor Scheduled Tasks on Windows Server

Scheduled Tasks are a great way to run scripts at specified time intervals. Similar to Unix cron. Because it’s such a powerful tool, it can be easy to abuse by programs that install their own schedule tasks. Most times without any transparency to the user that a task is being created. It’s also a potential target for malware to install persistent tasks that go unnoticed.

On managed servers, I want transparency into which tasks are installed. I created a powershell script with an array of “whitelisted” tasks, then created a scheduled tasks to check the name of the scheduled tasks installed. The results are sent to InfluxDB and If a task is not on my white list, an alert is sent with Grafana.

The powershell script and scheduled task can be found here.

When first installed, it reports the total number of scheduled tasks, and total number of non-Microsoft tasks. By default, I ignore Microsoft tasks installed on a new install.
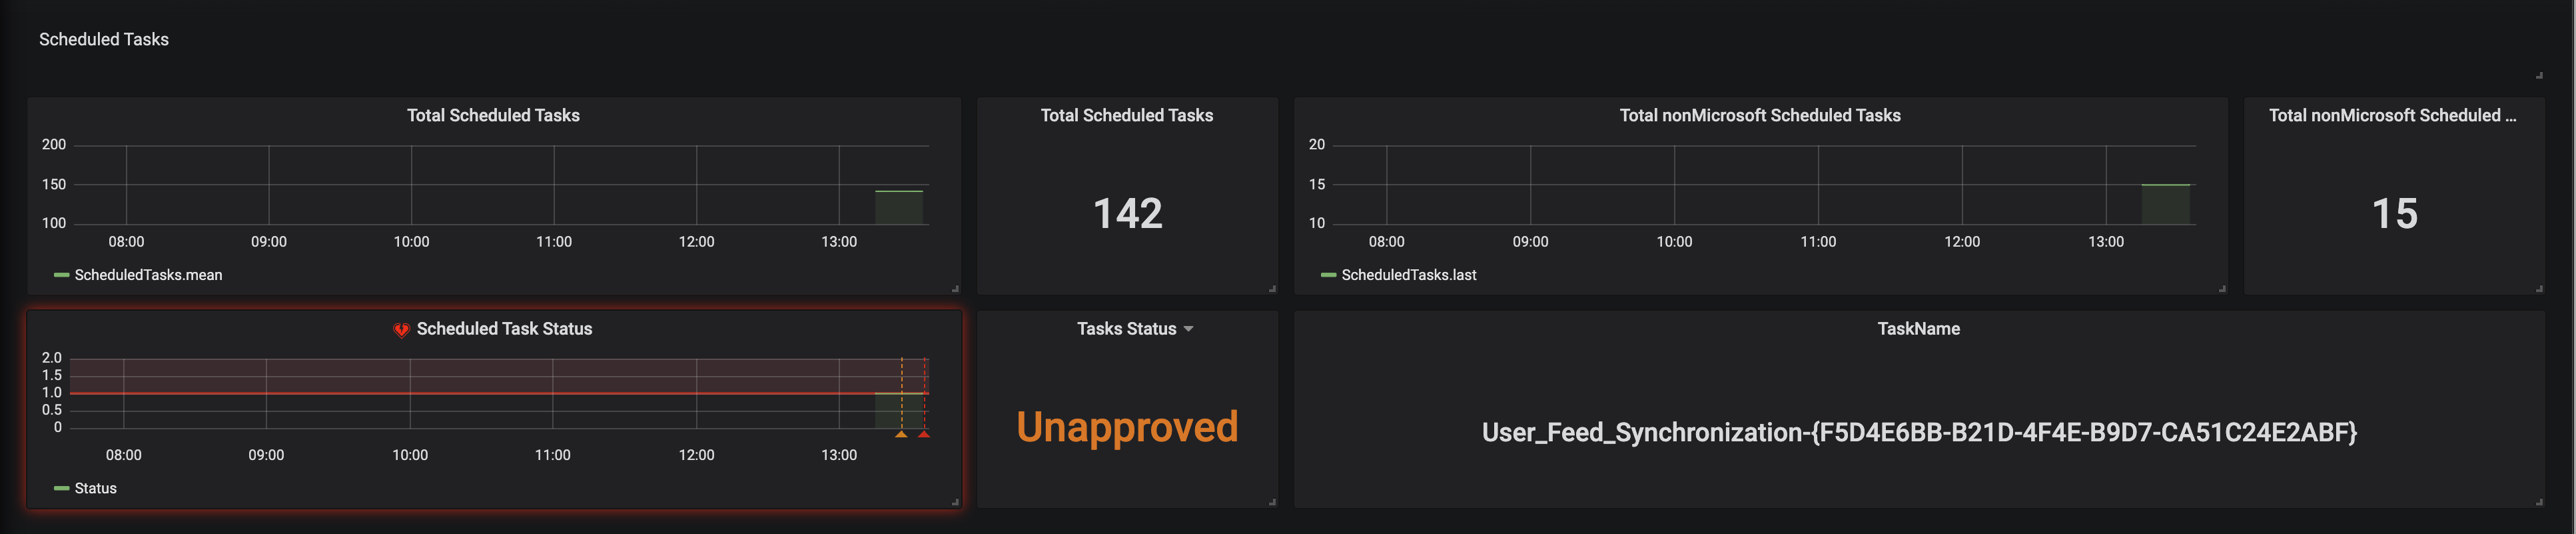
In this scenario you can see an alert has been triggered, because there is an Unapproved task, and to the right, it shows the name of the task, User_Feed_ ...

Now you can log into the computer and check the task to decided if it needs added to your white list or deleted.
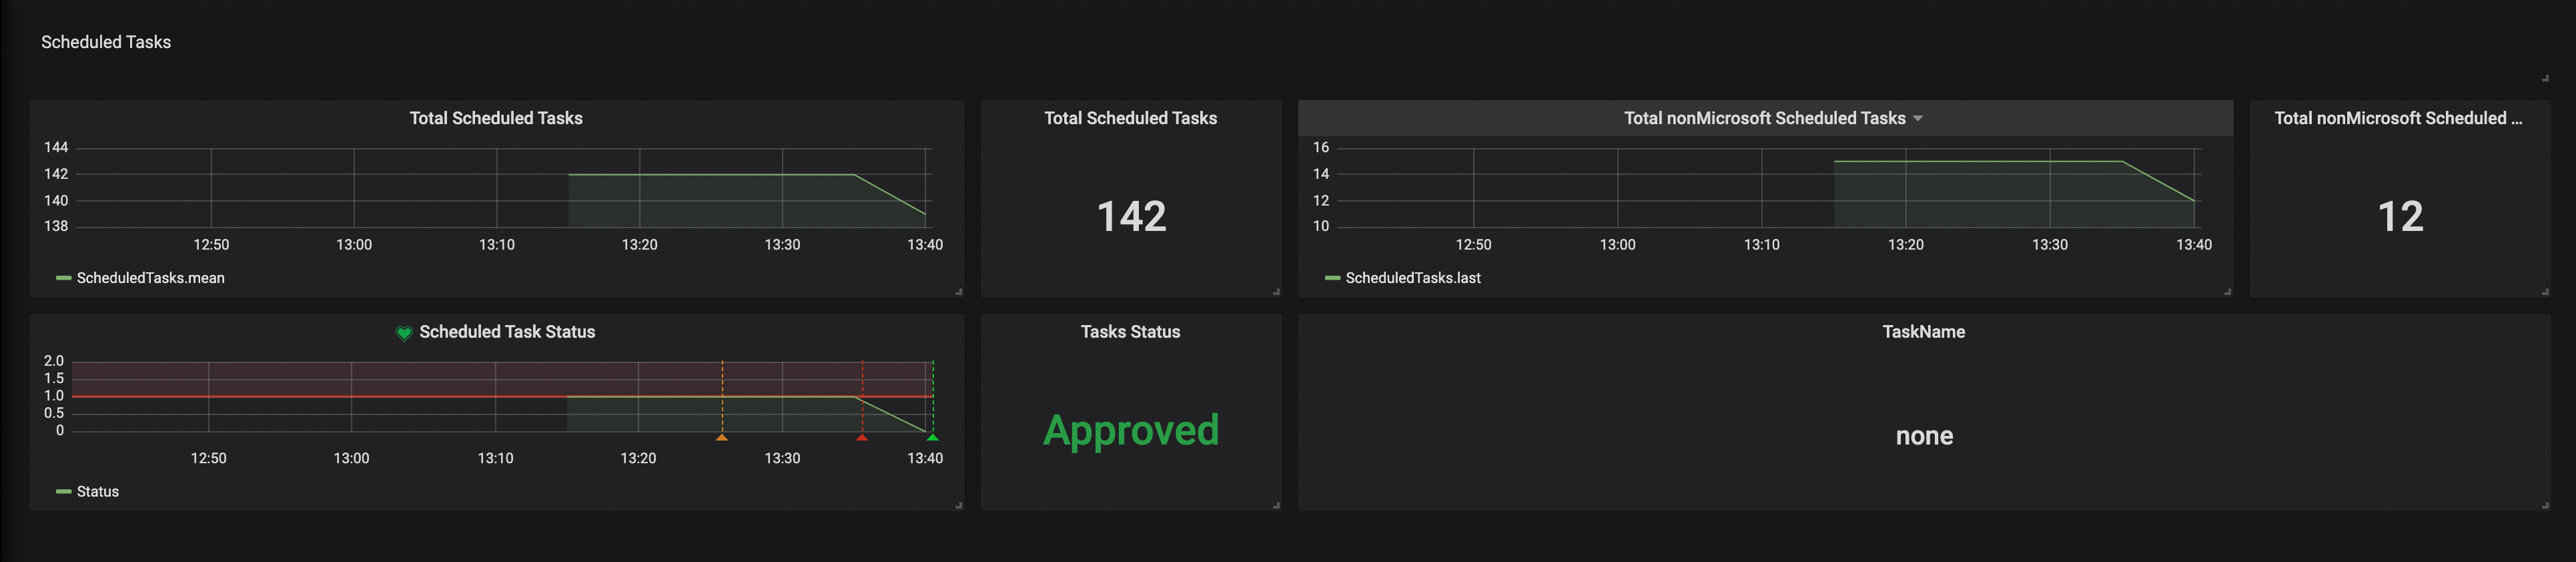
Once the task has been deleted, the alarm is cleared and all tasks report as Approved

Getting Windows Performance Counters Into InfluxDB and Grafana

I needed to get some Windows performance counters into InfluxDB, so I could setup some dashboards with Grafana. I’ve seen others post their default telegraf.conf files with the baseline CPU, Memory, Disk, etc … metrics. But I needed to track some non-default metrics. Like, “SQL Server Batch Requests/sec“. I started out writing my own powershell, parsing the data and sending an “Invoke-WebRequest” to my InfluxDB with Line Protocol data.

Then I realized, I could probably copy an existing “[[inputs.win_perf_counters.object]]“ from the default telegraf.conf file. Then dig into Windows Performance Monitor to find the exact metric I need, and just switch the “ObjectName” and “Counters” out.

This is my example with Batch Requests/sec

  • Open Windows Performance Monitor
  • Click the green “+" button to add a counter
  • Find the counter you want, in this case “SQLServer:SQL Statistics“
  • Click the “upside down arrow” to the right
  • Select “Batch Requests/sec“
  • Click the “Add” button
  • Click “OK” to close the window
  • Verify you get the metrics you want
  • Make a note of the “Counter“, “Instance“, and “Object” names
  • Open your “telegraf.conf” file
  • Under the “Inputs” sections, copy an existing “[[inputs.win_perf_counters.object]]” section
  • Update “ObjectName” with the “Object” from Windows Performance Monitor
  • Update “Counters“, with the “Counter” name from Windows Performance Monitor
  • Update “Instances” with the instance name from Windows Performance Monitor. In this case “*” to choose All, since there is no specific name
  • Update “Measurement” with a name for the collection you want to use in InfluxDB to store the metrics. For this example, “win_sql“
  • Login to Grafana and add a new panel
  • Select your measurement from the telegraf.conf file (win_sql)
  • Select the Counter from the telegraf.conf file ,in the field box (Batch Requests/sec)

Setup Telegraf on an Apple M1 Mac Mini

I’m setting up a couple of Apple M1 Build servers and part of the setup is pushing metrics into Grafana with Telegraf. Here’s my basic install and setup.

Download and Install Telegraf

Down the installer from: https://portal.influxdata.com/downloads

Because this is a M1 Mac mini, I selected “macOS ARM64 (via singed .dmg)“

Expand dmg and copy Telegraf.app to the “/Applications” folder

Open the Telegraf.app and allow permissions to terminal

Set config File

I copy the config from a previous install or create /Applications/Telegraf.app/Contents/Resources/etc/telegraf/telegraf.conf . I used the defaults below. Theres nothing fancy going on here, I’m using the defaults from the example conf file.

# Telegraf Configuration

# Global tags can be specified here in key="value" format.
[global_tags]

# Configuration for telegraf agent
[agent]
  interval = "60s"
  round_interval = true
  metric_batch_size = 1000
  metric_buffer_limit = 10000
  collection_jitter = "0s"
  flush_interval = "10s"
  flush_jitter = "0s"
  precision = "s"
  hostname = ""
  omit_hostname = false

###################################################################
#                            OUTPUT PLUGINS                                   #
###################################################################
[[outputs.influxdb]]
  urls = ["http://servername:8086"]
  database = "telegraf"
  timeout = "5s"


###################################################################
#                            INPUT PLUGINS                                    #
###################################################################
# Read metrics about cpu usage
# [[inputs.cpu]]

# Read metrics about disk usage by mount point
[[inputs.disk]]
  ## Ignore mount points by filesystem type.
  ignore_fs = ["tmpfs", "devtmpfs", "devfs", "iso9660", "overlay", "aufs", "squashfs"]

# Get kernel statistics from /proc/stat
[[inputs.kernel]]
  # no configuration

# Read metrics about memory usage
[[inputs.mem]]
  # no configuration

# Get the number of processes and group them by status
[[inputs.processes]]
  # no configuration

# Read metrics about swap memory usage
[[inputs.swap]]
  # no configuration

# Read metrics about system load & uptime
[[inputs.system]]
  ## Uncomment to remove deprecated metrics.
  # fielddrop = ["uptime_format"]

Launch at Startup

Then I create a Launchagent for the user running telegraf. I copy the below and put it at ~/Library/Launchagents/com.telegraf.plist

<?xml version="1.0" encoding="UTF-8"?>
<!DOCTYPE plist PUBLIC "-//Apple//DTD PLIST 1.0//EN" "http://www.apple.com/DTDs/PropertyList-1.0.dtd">
<plist version="1.0">
<dict>
    <key>EnvironmentVariables</key>
    <dict>
        <key>PATH</key>
        <string>/usr/local/bin:/usr/bin:/bin:/usr/sbin:/sbin:/Library/Apple/usr/bin:/usr/local/sbin</string>
    </dict>
    <key>KeepAlive</key>
    <dict>
        <key>SuccessfulExit</key>
        <true/>
    </dict>
    <key>Label</key>
    <string>com.telegraf</string>
    <key>ProgramArguments</key>
    <array>
        <string>/Applications/Telegraf.app/Contents/Resources/usr/bin/telegraf</string>
        <string>--config</string>
        <string>/Applications/Telegraf.app/Contents/Resources/etc/telegraf/telegraf.conf</string>
    </array>
    <key>RunAtLoad</key>
    <true/>
</dict>
</plist>

Then I reboot the machine and log into my Grafana server. Duplicate an existing Dashboard from another build server and then wait a couple minutes and refresh until I see the new hostname pop up.

You can download the config files here