Hey folks,
I’m writing this article months after the last article. So today I’m going to write about Grok Filters designing. Before we continue the grok pattern I guess you have some an idea about basics in ELK stack. ELK is refer for for ElasticSearch, Logstash and Kibana. So what ELK doing is first check the log collections, do necessary processing and then inject to the Elastic search, ElasticSearch responsible for querying data and finally send those data Kibana to dashboard results. So today topic is related with how to write log data patterns that can be identified by Logstash. For that we can use Grok filters.
So let me explain the scenario first. There were different modules in our system which communicate each other and we got a requirement to analyses those log data for a reporting purpose. when I was analyzing those logs, I was able to find common log fields but the total count of log fields are different to each other. The main purpose of this task is to create a common Grok filter to identify all server logs and feed those data to the Kibana dashboard.
So I followed a simple format which need to be not complex, efficient and fail fast mechanism. So first thing is to configure FileBeat. FileBeat is responsible for grab logs from server and feed in to the Logstash. Here is an example.
This file contains hidden or bidirectional Unicode text that may be interpreted or compiled differently than what appears below. To review, open the file in an editor that reveals hidden Unicode characters.
Learn more about bidirectional Unicode characters
| input { | |
| beats { | |
| port => "5044" | |
| } | |
| } | |
| filter{ | |
| grok { | |
| match => { "message" => "%{TIMESTAMP_ISO8601:logDate} \[%{LOGLEVEL:logLevel}\] TIMESTAMP:%{NUMBER:timestamp},MODULE_NAME:%{NOTSPACE:moduleName},THREAD:%{INT:thread},PID:%{INT:processId},CLASS:%{NOTSPACE:className},METHOD_NAME:%{NOTSPACE:methodName},CUSTOMER_ID:%{NOTSPACE:customerId},APPLICATION_ID:%{NOTSPACE:applicationId},USER_ID:%{NOTSPACE:userId},SESSION_ID:%{NOTSPACE:sessionId},TURN_ID:%{NOTSPACE:turnId},LOG_MESSAGE:%{GREEDYDATA:logMessage}" } | |
| } | |
| if "_grokparsefailure" in [tags] { | |
| grok { | |
| match => { "message" => "%{TIMESTAMP_ISO8601:logDate} \[%{LOGLEVEL:logLevel}\] TIMESTAMP:%{NUMBER:timestamp},MODULE_NAME:%{NOTSPACE:moduleName},THREAD:%{INT:thread},PID:%{INT:processId},CLASS:%{NOTSPACE:className},METHOD_NAME:%{NOTSPACE:methodName},CUSTOMER_ID:%{NOTSPACE:customerId},APPLICATION_ID:%{NOTSPACE:applicationId},USER_ID:%{NOTSPACE:userId},SESSION_ID:%{NOTSPACE:sessionId},LOG_MESSAGE:%{GREEDYDATA:logMessage}" } | |
| remove_tag => ["_grokparsefailure"] | |
| } | |
| } | |
| if "_grokparsefailure" in [tags] { | |
| grok { | |
| match => { "message" => "%{TIMESTAMP_ISO8601:logDate} \[%{LOGLEVEL:logLevel}\] TIMESTAMP:%{INT:timestamp},MODULE_NAME:%{NOTSPACE:moduleName},THREAD:%{INT:thread},PID:%{INT:processId},CLASS:%{NOTSPACE:className},METHOD_NAME:%{NOTSPACE:methodName},EVENT_NAME:%{NOTSPACE:eventName},CUSTOMER_ID:%{NOTSPACE:customerId},APPLICATION_ID:%{NOTSPACE:applicationId},USER_ID:%{NOTSPACE:userId},LOG_MESSAGE:%{GREEDYDATA:logMessage}" } | |
| remove_tag => ["_grokparsefailure"] | |
| } | |
| } | |
| if "_grokparsefailure" in [tags] { | |
| grok { | |
| match => { "message" => "%{TIMESTAMP_ISO8601:logDate} \[%{LOGLEVEL:logLevel}\] TIMESTAMP:%{INT:timestamp},MODULE_NAME:%{NOTSPACE:moduleName},THREAD:%{INT:thread},PID:%{INT:processId},CLASS:%{NOTSPACE:className},METHOD_NAME:%{NOTSPACE:methodName},CUSTOMER_ID:%{NOTSPACE:customerId},APPLICATION_ID:%{NOTSPACE:applicationId},USER_ID:%{NOTSPACE:userId},LOG_MESSAGE:%{GREEDYDATA:logMessage}" } | |
| remove_tag => ["_grokparsefailure"] | |
| } | |
| } | |
| } | |
| output { | |
| #Output the filtered logs to elastic search | |
| amazon_es { | |
| index => "logstash-%{+YYYY.MM.dd}" | |
| hosts => | |
| region => | |
| aws_access_key_id => | |
| aws_secret_access_key => | |
| template => | |
| retry_max_items => | |
| } | |
| } |
Here this is a basic example that I used to checked all the logs one after another. So here i check “_grokparsefailure” to check next pattern if the existing log pattern is not matching. “_grokparsefailure” is appear under [tags] if the first matching is not matched with the provided server log. You can test this on your local machine. For that first you need to download Logstash.
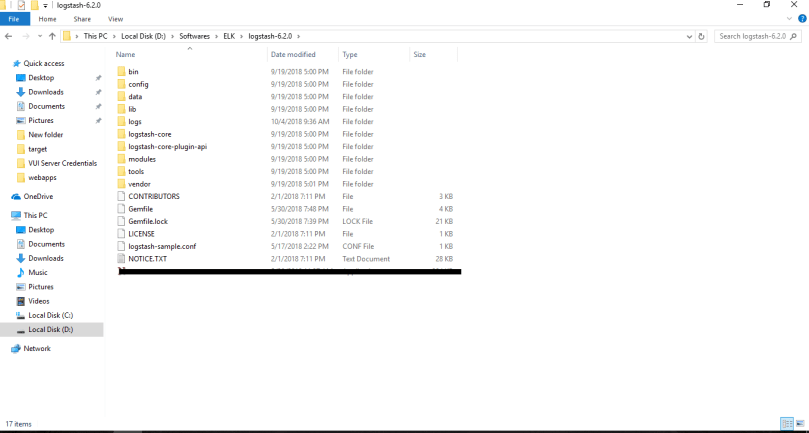
This is where I placed the Logstash
Now we need to few modifications on logstashConfiguration.conf file which mentioned earlier. Basically we are going to remove beat tag because we are not going to feed server logs through the FileBeat. So logs going to be inserted using command prompt and output can be configured to see in the console. So here is the customized logstash configuration.
This file contains hidden or bidirectional Unicode text that may be interpreted or compiled differently than what appears below. To review, open the file in an editor that reveals hidden Unicode characters.
Learn more about bidirectional Unicode characters
| input { | |
| stdin { | |
| } | |
| } | |
| filter{ | |
| grok { | |
| match => { "message" => "%{TIMESTAMP_ISO8601:logDate} \[%{LOGLEVEL:logLevel}\] TIMESTAMP:%{NUMBER:timestamp},MODULE_NAME:%{NOTSPACE:moduleName},THREAD:%{INT:thread},PID:%{INT:processId},CLASS:%{NOTSPACE:className},METHOD_NAME:%{NOTSPACE:methodName},CUSTOMER_ID:%{NOTSPACE:customerId},APPLICATION_ID:%{NOTSPACE:applicationId},USER_ID:%{NOTSPACE:userId},SESSION_ID:%{NOTSPACE:sessionId},TURN_ID:%{NOTSPACE:turnId},LOG_MESSAGE:%{GREEDYDATA:logMessage}" } | |
| } | |
| if "_grokparsefailure" in [tags] { | |
| grok { | |
| match => { "message" => "%{TIMESTAMP_ISO8601:logDate} \[%{LOGLEVEL:logLevel}\] TIMESTAMP:%{NUMBER:timestamp},MODULE_NAME:%{NOTSPACE:moduleName},THREAD:%{INT:thread},PID:%{INT:processId},CLASS:%{NOTSPACE:className},METHOD_NAME:%{NOTSPACE:methodName},CUSTOMER_ID:%{NOTSPACE:customerId},APPLICATION_ID:%{NOTSPACE:applicationId},USER_ID:%{NOTSPACE:userId},SESSION_ID:%{NOTSPACE:sessionId},LOG_MESSAGE:%{GREEDYDATA:logMessage}" } | |
| remove_tag => ["_grokparsefailure"] | |
| } | |
| } | |
| if "_grokparsefailure" in [tags] { | |
| grok { | |
| match => { "message" => "%{TIMESTAMP_ISO8601:logDate} \[%{LOGLEVEL:logLevel}\] TIMESTAMP:%{INT:timestamp},MODULE_NAME:%{NOTSPACE:moduleName},THREAD:%{INT:thread},PID:%{INT:processId},CLASS:%{NOTSPACE:className},METHOD_NAME:%{NOTSPACE:methodName},EVENT_NAME:%{NOTSPACE:eventName},CUSTOMER_ID:%{NOTSPACE:customerId},APPLICATION_ID:%{NOTSPACE:applicationId},USER_ID:%{NOTSPACE:userId},LOG_MESSAGE:%{GREEDYDATA:logMessage}" } | |
| remove_tag => ["_grokparsefailure"] | |
| } | |
| } | |
| if "_grokparsefailure" in [tags] { | |
| grok { | |
| match => { "message" => "%{TIMESTAMP_ISO8601:logDate} \[%{LOGLEVEL:logLevel}\] TIMESTAMP:%{INT:timestamp},MODULE_NAME:%{NOTSPACE:moduleName},THREAD:%{INT:thread},PID:%{INT:processId},CLASS:%{NOTSPACE:className},METHOD_NAME:%{NOTSPACE:methodName},CUSTOMER_ID:%{NOTSPACE:customerId},APPLICATION_ID:%{NOTSPACE:applicationId},USER_ID:%{NOTSPACE:userId},LOG_MESSAGE:%{GREEDYDATA:logMessage}" } | |
| remove_tag => ["_grokparsefailure"] | |
| } | |
| } | |
| } | |
| output { | |
| stdout { codec => rubydebug } | |
| } |
Let’s see the pattern works or not 🙂
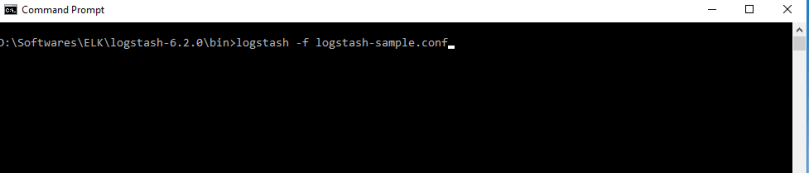
First go into logstash-6.2.0 bin folder and place the logstash-sample.conf file inside bin folder. 
Open command prompt and go to the bin folder and run following command
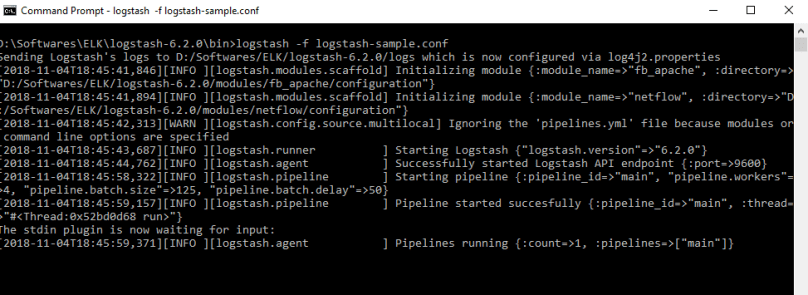
It will take some time to configure grok filter in Logstash. Then after all done you can see following behavior.
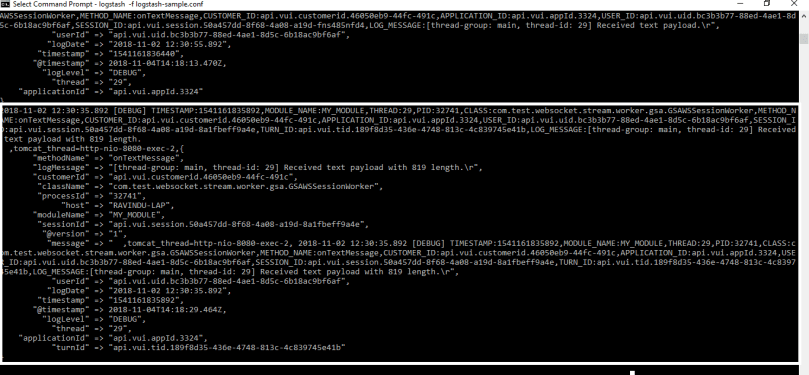
Here I got some logs from server which cover all three patterns provided in the Grok filter. So just copy and paste following logs in the cmd (Here i have changed the server logs to show you that grok filter works fine as expected) .
2018-11-02 12:30:35.892 [DEBUG] TIMESTAMP:1541161835892,MODULE_NAME:MY_MODULE,THREAD:29,PID:32741,CLASS:com.test.websocket.stream.worker.gsa.GSAWSSessionWorker,METHOD_NAME:onTextMessage,CUSTOMER_ID:api.vui.customerid.46050eb9-44fc-491c,APPLICATION_ID:api.vui.appId.3324,USER_ID:api.vui.uid.bc3b3b77-88ed-4ae1-8d5c-6b18ac9bf6af,SESSION_ID:api.vui.session.50a457dd-8f68-4a08-a19d-8a1fbeff9a4e,TURN_ID:api.vui.tid.189f8d35-436e-4748-813c-4c839745e41b,LOG_MESSAGE:[thread-group: main, thread-id: 29] Received text payload with 819 length.
,tomcat_thread=http-nio-8080-exec-2,
2018-11-02 12:30:55.892 [DEBUG] TIMESTAMP:1541161836440,MODULE_NAME:MY_MODULE2,THREAD:29,PID:32741,CLASS:com.test.websocket.stream.worker.gsa.GSAWSSessionWorker,METHOD_NAME:onTextMessage,CUSTOMER_ID:api.vui.customerid.46050eb9-44fc-491c,APPLICATION_ID:api.vui.appId.3324,USER_ID:api.vui.uid.bc3b3b77-88ed-4ae1-8d5c-6b18ac9bf6af,SESSION_ID:api.vui.session.50a457dd-8f68-4a08-a19d-fns485nfd4,LOG_MESSAGE:[thread-group: main, thread-id: 29] Received text payload.
,tomcat_thread=http-nio-8080-exec-2,
So can see that all logs are well formatted and each log fields are identified by the Logstash through the Grok patterns.
This is my first time using the grok filters. I faced several issues while find a matching solution to this scenario. So That’s why I thought to write this blog. Hope you get some idea about using grok filters configuration 🙂 .Thanks for reading .