


Overall Equipment Effectiveness (OEE) Calculator v2.5
Equipment / Area
Date
Full Window Time
Total duration of the given time period
Total duration of the given time period
⏱
hours
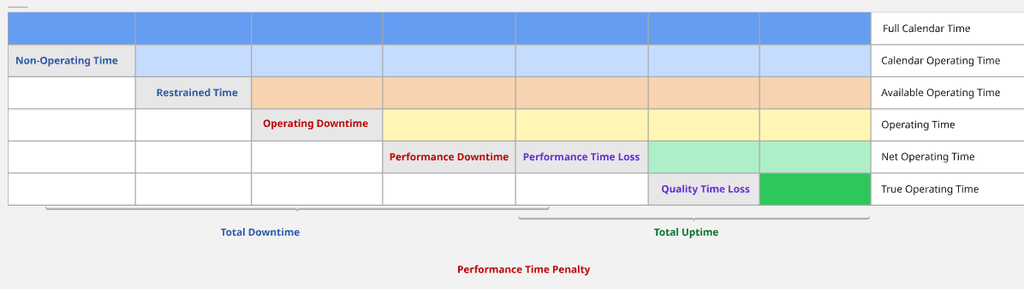
Non-Operating Time
Equipment is not in use nor expected to be (No schedule, weekend, off-shift, preventative maintenance, etc.)
Equipment is not in use nor expected to be (No schedule, weekend, off-shift, preventative maintenance, etc.)
⏱
hours
Ideal Cycle Unit of Time:
Restrained Time
Downtime due to upstream and downstream issues
Downtime due to upstream and downstream issues
⏱ hours
Ideal Cycle Rate
highest possible # of cycles that can run in the unit of time selected
highest possible # of cycles that can run in the unit of time selected
cycles per
hour
Operating Downtime
Downtime due to major failures and interruptions
Downtime due to major failures and interruptions
⏱ hours
Ideal Operating Cycle Count
0 cycles
Performance Downtime
Downtime due to microstops and operations challenges
Downtime due to microstops and operations challenges
⏱ hours
Operating Cycle Count:
actual # of cycles completed
actual # of cycles completed
Total Uptime
⏱ 12 hours
Quality Cycle Loss:
# of cycles that failed quality inspection
# of cycles that failed quality inspection
Operating Time
Total Uptime + Performance Downtime
Total Uptime + Performance Downtime
⏱ 13 hours
95% OEE
(Availability * Performance * Quality)
(Availability * Performance * Quality)
|
95%
Availability |
95%
Performance |
95%
Quality |
Availability
Full Window Time
⏱ 24 hours
Non-Operating Time
Scheduled downtime for maintenance, time off, or no orders
Scheduled downtime for maintenance, time off, or no orders
⏱ 8
hours
Calendar Operating Time
⏱ 16 hours
Restrained Time
Downtime due to upstream and downstream issues
Downtime due to upstream and downstream issues
⏱ 2 hours
Available Operating Time
⏱ 14 hours
Operating Downtime
Downtime due to major failures and interruptions
Downtime due to major failures and interruptions
⏱ 1 hours
Operating Time
⏱ 13 hours
Performance Downtime
Downtime due to microstops and operations challenges
Downtime due to microstops and operations challenges
⏱ 1 hours
Total Downtime
⏱ 10 hours
Total Uptime
⏱ 12 hours
Availability
(Operating Time /
Available Operating Time)
Available Operating Time)
95%
Performance
Operating Time
Time running after removing all logged downtime (except Performance)
Time running after removing all logged downtime (except Performance)
⏱ 13 hours
Production Stats
Ideal Operating Cycle Count
0 cycles
Ideal Cycle Rate
0 cycles per hour
Operating Cycle Count
0 cycles
total
Operating Cycle Rate
0 cycles per
hour
Performance Cycle Loss
Cycles not completed due to running slow and minor delays
Cycles not completed due to running slow and minor delays
0 cycles total
Performance Time Penalty
⏱ 0 hours
( Performance Time Loss
⏱ 0 hours +
Performance Downtime
⏱ 0 hours )
Net Operating Time
⏱ 10 hours
Performance
(Net Operating Time
/ Operating Time)
/ Operating Time)
95%
Quality
Net Operating Time
Equivalent of time running cycles at full speed during Operating Time
(Operating Time – Operating Time Loss)
Equivalent of time running cycles at full speed during Operating Time
(Operating Time – Operating Time Loss)
⏱ 10 hours
Production Stats
Operating Cycle Count
???? cycles
???? cycles
Quality Cycle Loss
Cycles that failed quality inspection
Cycles that failed quality inspection
0
cycles
Quality Time Loss
⏱ 0 hours
Quality Cycle Count
0 cycles
True Operating Time
Equivalent of time running at full speed during Operating Time, perfectly
Equivalent of time running at full speed during Operating Time, perfectly
⏱ 18.2 hours
Quality
(True Operating Time
/ Net Operating Time)
/ Net Operating Time)
95%
95% OEE
(Availability * Performance * Quality)
(Availability * Performance * Quality)
|
95%
Availability |
95%
Performance |
95%
Quality |