WP Debug Toolkit: The Top Debugging Plugin for WordPress
I’ve spent countless hours staring at the “white screen of death,” wondering which specific plugin update finally broke the site. In those moments, having a reliable way to cut through the noise of error logs is often the difference between a quick fix and a lost afternoon of troubleshooting.
WP Debug Toolkit is a WordPress debugging plugin that provides monitoring and debugging features directly into your workflow. In this review, I’ll explore its interface, test its error-tracking capabilities, and break down its pricing.
WP Debug Toolkit Review Quick Links
- What is WP Debug Toolkit?
- Interface and Ease of Use
- Error Tracking and Log Management
- Database Query Performance and Insights
- Site Monitoring and Proactive Alerts
- Security
- Performance Impact
- WP Debug Toolkit Limitations and Shortcomings
- What Real Users Actually Say
- Pricing Plans
- Is WP Debug Toolkit Worth It?
What is WP Debug Toolkit?

WP Debug Toolkit is a comprehensive WordPress debugging plugin that provides a dedicated environment for troubleshooting. It consists of three specific modules, which include an Error Log Viewer, a Query Viewer, and a Site Monitor.
These tools work together to identify PHP errors, database bottlenecks, and site crashes without the typical technical hurdles. In my experience, the plugin acts as a comprehensive suite to help you navigate site health and performance through a clean interface that is easy for both developers and site owners to use.
I tested WP Debug Toolkit by installing it on a staging site where I intentionally triggered fatal PHP errors and slow database queries. I checked if the independent Viewer App stayed active during a total site crash and monitored how the plugin handled large log files. I also verified the Site Monitor’s reliability by forcing “Out of Memory” errors to see if the emergency memory fallback correctly delivered email alerts to my inbox.
Interface and Ease of Use
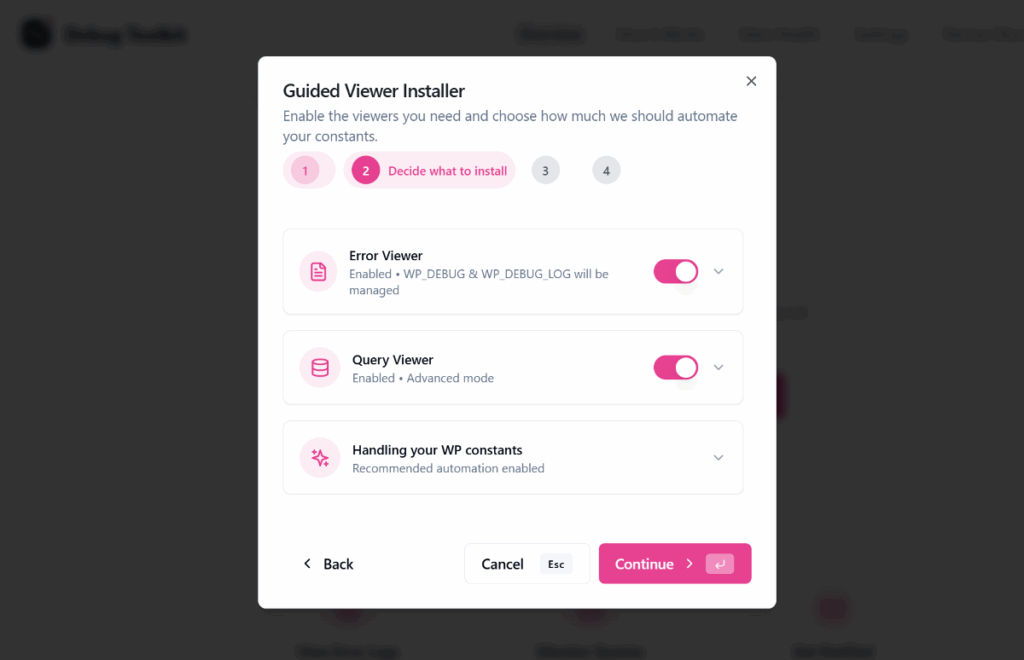
I launched the configuration wizard by clicking the Run Setup Installer button on the main overview screen. This installer guides you through several simple steps to get the log and query viewer app installed on your website.

First, it lets you choose between using a custom URL or the default one for the setup. I then selected the specific tools I wanted to activate, such as the log viewer and the query monitor. Finally, I added a password to the app to ensure the log data remains secure and private.
The viewer app interface itself is remarkably well-organized. A sidebar on the left lets you switch instantly between the different modules. You’ll find that the Error Logs, Query Monitor, and Crash Recovery tools are all just a single click away. I noticed the layout is very spacious and puts your site data in the center of the screen. Important settings and the theme switcher are tucked neatly at the bottom of the sidebar. It feels like a professional development environment rather than a standard WordPress settings page.

The Error Logs view presents a clean table that lists timestamps and error levels clearly. I like that the plugin uses colour coded labels like Parse or Warning to help you prioritize your troubleshooting. When I opened a specific error, the detailed file viewer showed me the exact file path and line number. It even includes a built-in code editor view. There is a helpful button that allows you to jump directly to the problematic line of code, so you do not have to search for it manually.

Navigating the Query Monitor is just as simple and intuitive. It displays SQL queries with execution times and performance scores to help you spot bottlenecks. I noticed that it clearly identifies the source of each query, such as WordPress Core or a specific plugin.

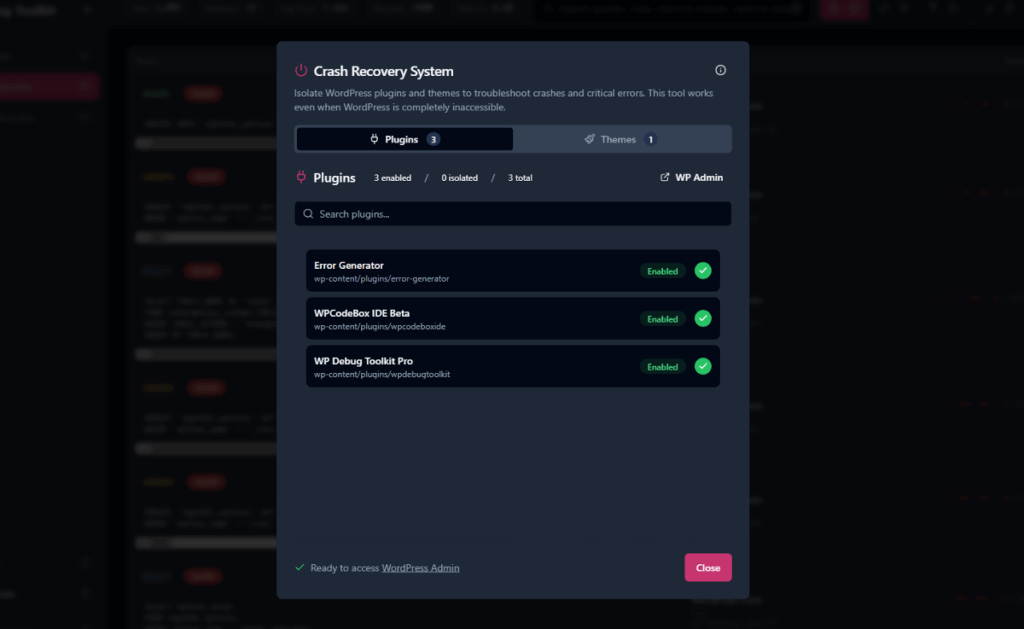
If your site suffers a major crash, the Crash Recovery module provides a dedicated interface to isolate broken themes and plugins. You can disable them one by one through a clean modal window until you regain access to your admin dashboard.
Error Tracking and Log Management
WP Debug Toolkit transforms the standard WordPress error log into a professional management dashboard. Instead of scrolling through a massive text file, you see a structured table that is easy to read. I found that the layout makes it much simpler to spot recurring issues across your entire site.
The search bar is one of the most powerful parts of this interface. It allows you to use specific operators to narrow down your results. You can use a plus sign to include a term or a minus sign to exclude one. This is incredibly helpful when you need to hide a specific plugin’s notices while you focus on a different error.

The top bar also contains several small buttons to speed up your troubleshooting. You will see an auto-refresh icon that looks like a play button. When you enable this, the logs update in real time as actions occur on your site. This eliminates the need to manually refresh the page while you are testing a specific feature.

I noticed that the filtering options are remarkably intuitive. You can toggle specific error levels like Notices, Warnings, or Parse errors on and off. This allows you to hide minor warnings so you can focus exclusively on the fatal errors that are breaking your site. It is a much faster way to find the signal in the noise of a busy log file.

Managing your data with WP Debug Toolkit is also quite straightforward. There are dedicated buttons to copy a single entry or the entire log to your clipboard. If you need to share the logs with a support team or a client, you can use the export button to download the data as a file. There is even a trash icon that lets you clear the log history instantly to start a fresh session.

Each entry in the list shows you the exact line number where the error occurred. What I like is that WP Debug Toolkit includes an integrated file viewer that shows you the actual PHP code with the problematic line highlighted in red. It provides the full context of the file so you can understand why the error was triggered without opening an external code editor.
Database Query Performance and Insights
WP Debug Toolkit also includes a Query Viewer that gives you deep visibility into your site’s database performance without adding extra load to your environment. I found that it handles monitoring much differently than traditional plugins that store their data inside the WordPress database itself. WP Debug Toolkit’s file-based logging system is particularly efficient because it stores query data as JSON on the disk instead of in your database tables. This approach ensures that the monitoring process does not slow down the very site you are trying to optimize.
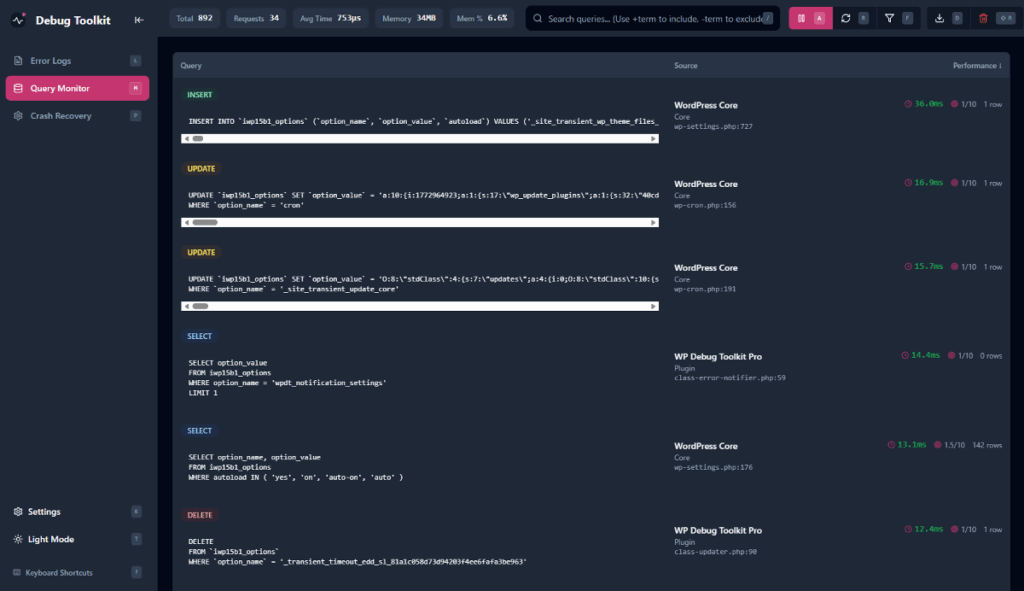
I noticed that its component attribution feature is remarkably precise during my testing. It shows you which specific plugin, theme, or WordPress core triggered a query. This eliminates the guesswork when you are trying to find what is causing a performance bottleneck. WP Debug Toolkit’s complexity scoring also assigns a value from one to ten based on the SQL structure. It analyzes joins and subqueries to help you understand the relative “cost” of every query on the page.

WP Debug Toolkit’s slow query detection is a vital tool for maintaining a fast website. You can set a custom threshold, and the plugin will automatically flag any query that exceeds that limit for your review.

I also found that WP Debug Toolkit’s N+1 pattern alert is incredibly helpful for catching inefficient loops. It identifies instances where the same query is being run dozens or hundreds of times in a row. These types of silent performance killers are often missed by standard debugging methods, but are made visible here.

The live monitoring dashboard allows you to watch database activity in real time as you browse your site. I found this to be especially useful for checking the database impact of complex actions like WooCommerce checkout flows.
WP Debug Toolkit’s integrated file viewer also works here to show you the exact PHP execution path for any query. You can expand any entry to see the full stack trace and then jump directly to the code that triggered the call. If you need to collaborate with other developers, WP Debug Toolkit’s data export feature allows you to save your query logs as CSV or JSON files for further analysis.

Site Monitoring and Proactive Alerts
WP Debug Toolkit’s Site Monitor acts as an automated shield for your WordPress website. It alerts you the moment something breaks, so you can respond before your clients or users even notice a problem. It is unique because it is built to remain functional even during the most severe site crashes.
The plugin uses a dual-channel delivery system for reliable notifications. When a WordPress site suffers a major error, the standard mail functions often fail alongside the rest of the site. WP Debug Toolkit’s fail safe fallback automatically switches to native PHP mail if the standard WordPress mail delivery fails. This ensures that you receive the alert regardless of the site’s internal state.
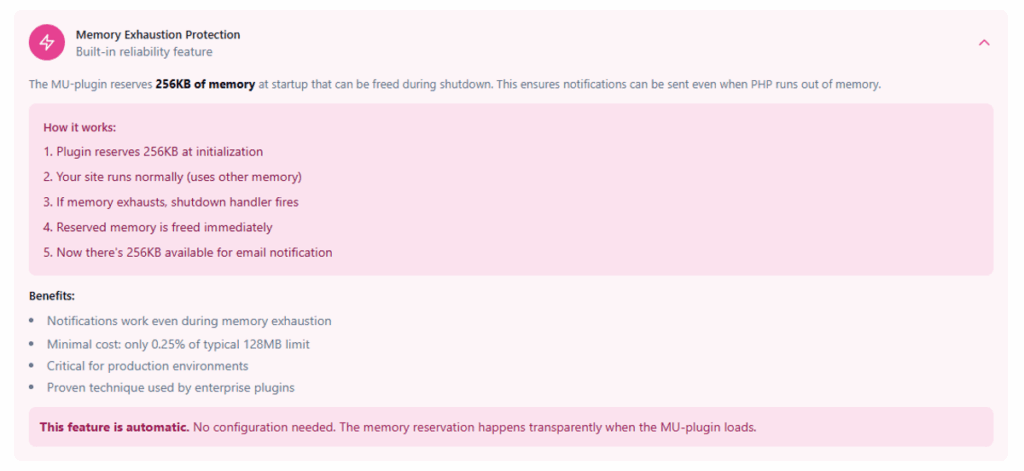
WP Debug Toolkit’s emergency memory protection is another feature that’s incredibly impressive. The plugin reserves a special block of system memory to ensure that it can still send an alert even during a fatal “Out of Memory” exhaustion. Most other WordPress debugging plugins would simply crash under these conditions, but WP Debug Toolkit remains active to provide you with the critical information.
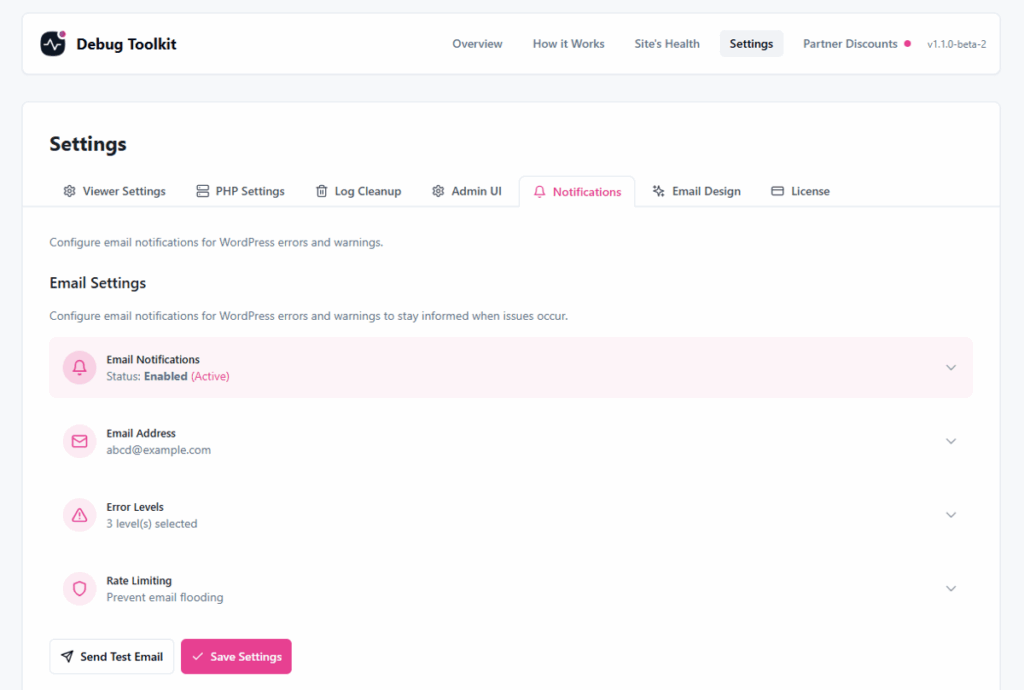
It also includes a smart rate-limiting feature that groups repeated errors to prevent inbox flooding. The enhanced recovery emails that you get include direct links to the log viewer and WordPress recovery mode. This allows you to identify root causes before attempting repairs.
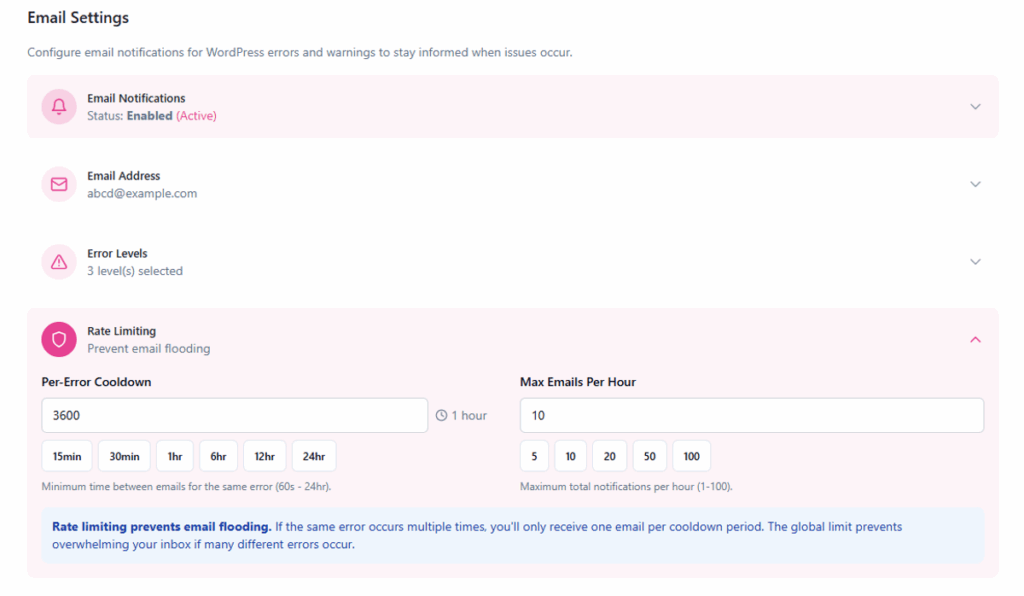
For those managing sites for clients, the white-labeling features are a significant benefit. You can fully customize the email templates with your own agency logo and brand colors and transform a scary error notification into a professional and managed report.
Security
WP Debug Toolkit comes with several security features to protect your debugging data. The standalone viewer app requires a password setup during the initial configuration to ensure that unauthorized users cannot access your error logs or query data.

The plugin allows you to set a custom URL for the viewer app, which adds an extra layer of security through obscurity. I noticed that this is particularly useful when using the tool on client sites where you want to limit access to debugging information.
Performance Impact
WP Debug Toolkit uses file-based logging to store query data as JSON on the disk rather than in your WordPress database. This approach ensures the monitoring process does not add extra strain to your database, providing a significant advantage over traditional monitoring plugins that store data in database tables.
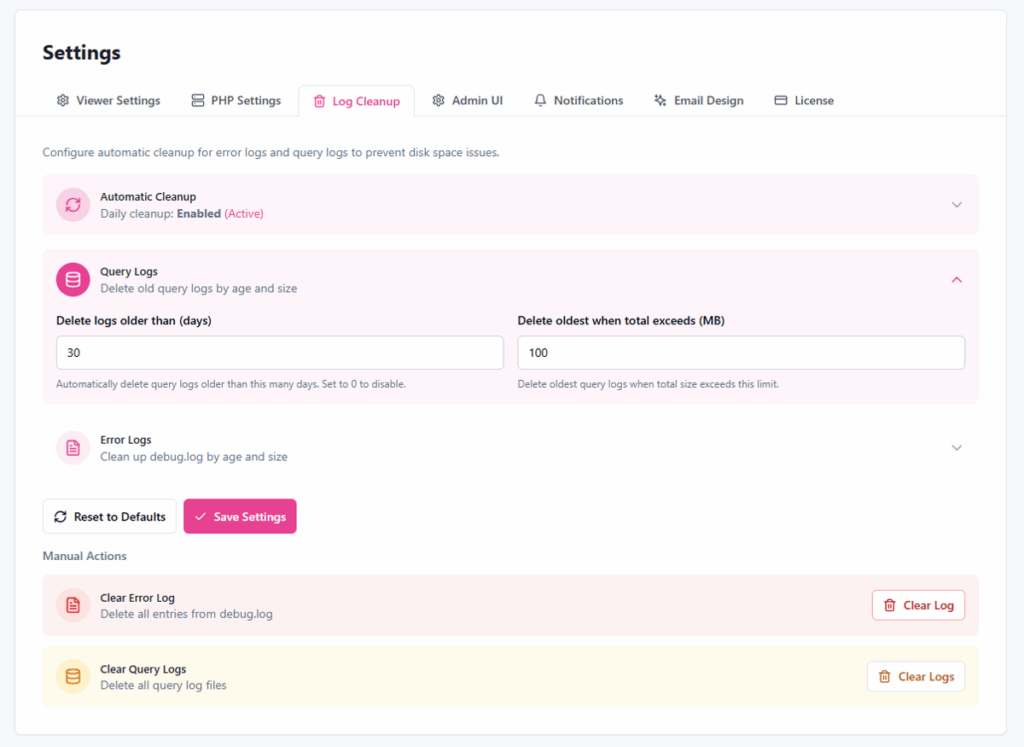
The plugin also manages disk space proactively through its Log Cleanup settings. You can configure automatic daily cleanup for both error and query logs based on file age and size, which prevents your storage from becoming overwhelmed by old data. You also have the option to manually clear logs at any time, which helps keep your server environment tidy without needing to interact with the filesystem directly.
WP Debug Toolkit Limitations and Shortcomings
WP Debug Toolkit is a premium-only plugin, which means there is a cost involved to access its full features. Unlike free alternatives, you will need to invest in a license to use the suite. I found that this makes it better suited for professional developers or agencies rather than casual users who may not need its advanced features.
Since the plugin is relatively new to the ecosystem, it has a smaller community compared to established plugins. This means fewer tutorials, third-party integrations, and community-driven documentation are available. You may need to rely more on official support channels rather than documentation for troubleshooting.
While the plugin excels at application-level debugging, it does not provide deep server-level infrastructure metrics. This is not necessarily a drawback since it focuses on a different scope, but it is worth noting for those who need comprehensive server monitoring alongside their application debugging.
What Real Users Actually Say
Even though WP Debug Toolkit is a new plugin in the WordPress ecosystem, it has quickly gained a strong reputation among professional developers and agency owners. If you look at the early feedback, most users are praising its crash resilience.
Most developers are also particularly impressed with the standalone nature of the viewer. One developer mentions that the ability to use the log view even when the site has “white screened” is a must-have feature for anyone doing PHP work. Another user points out that it is awesome that the tool remains functional even when a fatal error occurs.

Efficiency and time savings are also common praises among current users. One agency owner mentions that the plugin has cut their workload by approximately 20 percent since they started using it. Another reviewer shares that it has quietly become one of their must-have plugins because it helps them catch issues the moment they happen during active development work.
How It Compares to Other Debugging Plugins
If you are trying to decide which debugging plugin is right for your specific needs, you might find it helpful to see how WP Debug Toolkit compares against other popular options in the market.
We have written detailed comparison articles that break down the differences across features, pricing, log management, and more:
- WP Debug Toolkit vs Query Monitor
- WP Debug Toolkit vs Debug Log Manager
- WP Debug Toolkit vs Debug Bar
- WP Debug Toolkit vs WP Debugging
Pricing Plans
WP Debug Toolkit uses a straightforward pricing model that is easy to understand. It offers three specific plans that vary based on the number of site licenses and the included debugging tools. I found that this structure makes it simple to choose a plan that meets your specific business needs.
Here is a breakdown of the available plans:
| Plan Name | Site Licenses | Price |
| Error Log Viewer Pro / Query Viewer Pro / Site Monitor Pro | 100 Sites | $49 / year |
| Unlimited Pro | Unlimited Sites | $99 / year |
| Lifetime Pro | Unlimited Sites | $499 / once |
The Unlimited Pro and Lifetime Pro plan includes all three tools along with real-time logging, advanced filtering, a crash recovery system, and an integrated file viewer.
Final Verdict: Is WP Debug Toolkit Worth It?
I believe WP Debug Toolkit is a necessary investment for anyone who manages more than a handful of WordPress sites professionally. It moves beyond simple error logging and provides a comprehensive safety net for your entire development environment. WP Debug Toolkit’s standalone architecture ensures that you never lose access to your site data during a critical crash.
If you are a developer who works on complex PHP themes or a large WooCommerce store, the Query Viewer alone justifies the cost. I found that the ability to spot N+1 patterns and slow queries without adding database bloat is a significant improvement over standard development workflows. WP Debug Toolkit’s proactive alerting system also gives you the peace of mind that you will be the first to know when something breaks.
The Unlimited Pro plan is the most sensible choice for professional users because it provides complete visibility across an unlimited number of sites. WP Debug Toolkit’s $99 annual price is a small amount to pay for a tool that can cut your troubleshooting time significantly. I found that the combination of crash recovery and performance monitoring makes this one of the most reliable debugging solutions currently available for WordPress.
Common Questions About WP Debug Toolkit
How to debug a WordPress website?
There are several ways to debug a WordPress website:
- Edit your wp-config.php file and enable the WP_DEBUG constant to start recording PHP errors.
- Use a dedicated debugging plugin like WP Debug Toolkit to access error logs through a dashboard interface.
- Install Query Monitor for detailed database query profiling during development.
- Check your server’s error logs through your hosting control panel or FTP.
- Use the WordPress Site Health tool to identify potential issues.
What are the risks of debug mode?
Leaving debug mode enabled on a live website poses several security risks. If you expose detailed error messages publicly, it can reveal your server’s file structure, plugin names, and version information to hackers. This information can help them identify vulnerabilities in your setup. Additionally, active debugging can slow down your site because the system must continuously monitor and record errors. For safety, you should only enable debug mode temporarily when troubleshooting and disable it immediately after.
How do I turn off WP debug?
To turn off WP debug, edit your wp-config.php file and change define( 'WP_DEBUG', true ); to define( 'WP_DEBUG', false );. You can also remove the debug constants entirely. If you prefer a graphical interface, you can use a plugin like WP Debug Toolkit to toggle debugging on and off with a single click directly from your WordPress dashboard.