Aprašymas
This is a WordPress plugin that provides a WordPress shortcode that will display your categories in a chart and another shortcode that will display your tags. This plugin requires that the Easy Chart Builder plugin by dyerware is installed and activated. See what it looks like on my blog.
This plugin is also available in my Github repository.
Usage
Show top 12 most popular categories in a pie chart:
[easychart_categories]
Show top 12 most popular tags in a pie chart:
[easychart_tags]
Show the first five categories, sorted by name, without counts, using custom colors, and with a summary data table of counts:
[easychart_categories showcounts="false" groupcolors="556270, 4ECDC4, C7F464, FF6B6B, C44D58" number="5"
    orderby="name" order="ASC" hidechartdata="false"]<h3>Options</h3>
See options for the WordPress function get_terms() and for the Easy Chart Builder plugin. Also:
showcounts– Show or hide the count for each category/tag. Valid values:true,false. Defaults totrue.
Ekrano nuotraukos
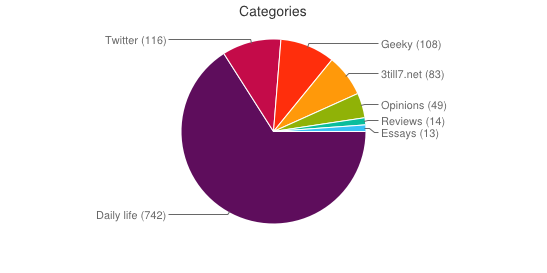
Sample chart showing top 12 categories. 
Sample chart showing top 12 tags.
Diegimas
- Install the Easy Chart Builder for WordPress plugin by dyerware.
- Activate the [Easy Chart Builder for WordPress plugin] through the WordPress administration ‘Plugins’ menu.
- Upload the entire Easy Chart Categories plugin directory, or just easy-chart-categories.php, to your
/wp-content/pluginsdirectory. - Activate the plugin through the WordPress administration ‘Plugins’ menu.
- Follow the usage instructions below, embedding one or more of the shortcodes in a page or post.
Atsiliepimai
Įskiepis neturi atsiliepimų.
Programuotojai ir komandos nariai
“Easy Chart Categories” yra atviro kodo programa. Prie jos sukūrimo prisidėję žmonės surašyti toliau.
AutoriaiIšverskite “Easy Chart Categories” į savo kalbą.
Domina programavimas?
Peržiūrėkite kodą, naršykite SVN repozitorijoje, arba užsiprenumeruokite kodo pakeitimų žurnalą per RSS.