


Abstract
Minimoons are asteroids that become temporarily captured by the Earth–Moon system. We present the discovery of 2024 PT5, a minimoon discovered by the Asteroid Terrestrial-impact Last Alert System Sutherland telescope on 2024 August 7. The minimoon with heliocentric semimajor axis, a ~ 1.01 au, and perihelion, q ~ 0.99 au, became captured by the Earth–Moon system on 2024 September 29 and left on 2024 November 25 UTC. Visible g, r, i, and Z spectrophotometry was obtained using Gemini North/Gemini Multi-Object Spectrograph on 2024 September 27. The color indices are g − r = 0.58 ± 0.04, r − i = 0.29 ± 0.04, and i − Z = −0.27 ± 0.06, and the spectrum best matches lunar rock samples followed by S-complex asteroids. Assuming an albedo of 0.21 and using our measured absolute magnitude of 28.64 ± 0.04, 2024 PT5 has a diameter of 5.4 ± 1.2 m. We also detect variations in the lightcurve of 2024 PT5 with a 0.28 ± 0.07 mag amplitude and a double-peaked period of ~2600 ± 500 s. We improve the orbital solution of 2024 PT5 with our astrometry and estimate the effect of radiation pressure on its deriving an area-to-mass ratio of 7.02 ± 2.05 × 10⁻⁵ m2 kg−1, implying a density of ~3.9 ± 2.1 g cm−3, compatible with having a rocky composition. If we assume 2024 PT5 is from the near-Earth object (NEO) population, its most likely sources are resonances in the inner Main Belt when we compare its orbit with the NEO population model though this does not exclude a lunar origin.

Original content from this work may be used under the terms of the Creative Commons Attribution 4.0 licence. Any further distribution of this work must maintain attribution to the author(s) and the title of the work, journal citation and DOI.
1. Introduction
Evidence from observations of near-Earth objects (NEOs) suggests that the majority originate from the Main Belt asteroids and Jupiter-family comet populations (M. Granvik et al. 2018; D. Nesvorný et al. 2023, 2024). A small percentage of NEOs can become temporary Earth co-orbitals, located in a 1:1 mean motion resonance with the Earth (M. H. M. Morais & A. Morbidelli 2002) where they can become Trojans or quasi-satellites of the Earth for several thousand years (R. Brasser et al. 2004). A small portion of NEOs, less than <10−7 of the total NEO population, can become temporarily captured by the Earth–Moon system's gravity and enter its Hill sphere, becoming a so-called “minimoon” (M. Granvik et al. 2013; R. Jedicke et al. 2018).
Minimoons are captured at low relative velocities with the Earth–Moon system, less than 1 km s−1, where they can be captured on timescales as long as tens of days to years (M. Granvik et al. 2012; G. Fedorets et al. 2017). The first known minimoon, 2006 RH120, remained in orbit around the Earth for ~400 days (T. Kwiatkowski et al. 2008), and the second, 2003 CD3 was captured for ~900 days (S. P. Naidu et al. 2021) before escaping the Earth's Hill sphere. Thus, the capture duration of minimoons represents a small portion of the time they share the Earth’s orbit.
While it is assumed that Earth co-orbitals such as minimoons are captured from the NEO population, emerging evidence suggests that some may originate as lunar impact ejecta. Ejecta from lunar impacts can be recaptured onto Earth-similar orbits where they can last for thousands of years (B. J. Gladman et al. 1995). Additionally, the observed spectral properties of some minimoons and quasi-satellites such as 2020 CD3 and (469219) Kamo‘oalewa resemble some lunar samples (B. T. Bolin et al. 2020; B. N. L. Sharkey et al. 2021). This evidence has led some to suggest a recent lunar impact as the origin for some Earth co-orbitals (e.g., Y. Jiao et al. 2024).
This Letter discusses the discovery of minimoon 2024 PT5 by the Asteroid Terrestrial-impact Last Alert System (ATLAS) telescope and observations taken at Gemini North (Gemini N). We will use the approach of B. T. Bolin et al. (2021, 2022, 2023) to use spectrophotometric observations at different visible wavelengths to constrain its physical properties as a test of whether 2024 PT5 has an asteroidal or lunar debris origin. We will also use the astrometry reported from our observations and the observations of others to refine the orbit of 2024 PT5, measuring the effect of nongravitational perturbations on its orbit (e.g., M. Micheli et al. 2012), and compare its orbit with the NEO population model (A. Morbidelli et al. 2020; D. Nesvorný et al. 2023).
2. Observations
The discovery observations of 2024 PT5 were taken on 2024 August 7 21:11:57 UTC at the ATLAS-Sutherland telescope, Minor Planet Center (MPC) observing code M22 (Figure 1; L. Denneau et al. 2024). At the time of the asteroid's discovery, the asteroid was located at R.A. = 18 57 04.97, decl. = −55 56 00.24 and 1.54 lunar distances (0.00397 au) au from the Earth, a heliocentric distance of 1.017 au, at a phase angle of 128 747, and had a visible magnitude of ~17. The asteroid was detected in four 30 s ATLAS o-band filter exposures spaced over ~1700 s. The ATLAS o-band filter provides coverage between 560 and 820 nm with an effective wavelength of 663 nm (J. L. Tonry et al. 2018). The asteroid was moving 13
 7 day−1 (0
 57 s−1) in the northwest direction at the time of discovery, resulting in having a trailed appearance in the ATLAS images (panels (a), (b), (c), and (d) of Figure 1). The trailed exposures of 2024 PT5 show little to no curvature over the 1700 s span of the discovery detections with a great circle residual of ~1
 2.

Figure 1. (a) The first of four o-band ATLAS-Sutherland telescope discovery images of 2024 PT5 from 2024 August 7 21:11:57 UTC. The asteroid moved at a rate of 34 3 hr−1 (13
 7 day−1) in the northwest direction. The asteroid makes a ~9 pixel trail in the 30 s ATLAS exposures, indicated by the red circle. (b) Same as panel (a) but shows the image after subtracting static sources. Despite the presence of nearby stars, the asteroid is detected cleanly in the subtracted images. (c) Same as panel (a), but the second of four o-band images containing 2024 PT5 taken on 2024 August 7 21:16:35 UTC. (d) Same as panel (c) but shows the image after subtracting static sources. The asteroid was detected with an apparent magnitude of o= 17.13 in panel (b) and o = 16.99 in panel (c). The large black areas in the subtracted images are regions of saturated pixels from bright stars. The direction of the asteroid and cardinal directions are indicated in each figure.
Download figure:
Standard image High-resolution imageOn 2024 September 27 05:54 UTC, 2024 PT5 was observed using the 8.1 m Gemini N telescope with the Gemini Multi-Object Spectrograph (GMOS) instrument (I. M. Hook et al. 2004) in imaging mode (Program ID GN-2024B-FT-106, PI: B. Bolin). GMOS was used with the Hamamatsu array with an effective pixel scale of 0 0807 pixel−1 in 2 × 2 binning mode. The images were taken in Sloan Digital Sky Survey (SDSS)–equivalent g, r, and i filters (effective wavelengths 475 nm, 630 nm, and 780 nm; M. Fukugita et al. 1996). For coverage of the spectrum of 2024 PT5 past 800 nm, we use the GMOS-N Z-band filter, which is effectively equivalent to the United Kingdom Infrared Telescope Wide-Field Camera (WFCAM) Z filter (P. C. Hewett et al. 2006). The WFCAM Z filter (effective wavelength 880 nm; M. Casali et al. 2007) was designed to be equivalent to the SDSS z filter (effective wavelength 890 nm) but avoids the atmospheric absorption band near 950 nm (S. T. Hodgkin et al. 2009).
The observations of 2024 PT5 with GMOS occurred when it was near R.A. = 16 59 59.22, decl. = +67 01 25.5, 8.74 lunar distances from the Earth (0.0225 au), a heliocentric distance of 1.000 au, and had a phase angle of 84 4. The seeing was ~0
 5–0
 6 during the 2024 PT5 observations as measured in g-band images, and the air mass ranged from 1.73 to 1.91 during the ~40 minute observing sequence. During the sequence, we acquired 12 × 75 s g-band exposures, 5 × 50 s r-band exposures, 3 × 60 s i-band exposures, and 3 × 90 s Z-band exposures. Observations in the g, r, i, and Z filters were interspersed throughout the observation sequence to mitigate the effects of brightness variations in 2024 PT5’s lightcurve on the color measurements. The telescope was tracked at the ~93″ hr−1 rate of 2024 PT5 during the exposures. Bias and flat frames were taken and used to detrend the images using the DRAGONS image pipeline (K. Labrie et al. 2023). Images of 2024 PT5 when it intersected a background star were discarded. Mosaics of the separate g, r, i, and Z median-combined composite stacks of the 2024 PT5 images are shown in Figure 2.

Figure 2. Top left panel: a median combination stack of 11 × 75 s g-filter images of 2024 PT5. An arrow indicating the width of 10″ is shown for scale, and the cardinal directions are indicated. Top right panel: a median combination stack of 5 × 50 s r-filter images of 2024 PT5. Bottom left panel: a median combination stack of 2 × 60 s i-filter images of 2024 PT5. Bottom right panel: a median combination stack of 2 × 60 s Z-filter images of 2024 PT5. The image scale and cardinal directions in the r, i, and Z stacks are the same as in the g-image stack.
Download figure:
Standard image High-resolution image3. Results
3.1. Astrometry and Orbital Determination
The astrometry from the Gemini N observations of 2024 PT5 was measured with the Astrometrica software (H. Raab 2012) combined with reference stars from the Gaia Data Release 2 catalog (Gaia Collaboration et al. 2016, 2018). We conservatively estimate an astrometric uncertainty of 1 0 in both the R.A. and decl. directions in line with the typical astrometric precision for most ground-based measurements (e.g., D. Farnocchia et al. 2022). Additionally, the timing of the GMOS instrument is accurate to within a few tenths of a millisecond, inducing negligible effect on the astrometry.8
The astrometry measured from the GMOS images was submitted to the MPC (G. V. Williams 2024). The GMOS astrometry of 2024 PT5 was combined with 200 additional 2024 PT5 observations taken independently by follow-up observers between 2024 August 7 UTC and 2024 October 24 UTC from the MPC archive.9
A complete table of the astrometry of 2024 PT5 is provided in Table A1 in the Appendix. We adopt conservative estimates for the astrometric uncertainties of ~1 0 in both R.A. and decl. for the other observatories’ measured positions except for observations made at the Great Shefford Observatory in West Berkshire, England (MPC observatory code J95), where we used an estimated uncertainty of 0
 4 (P. Vereš et al. 2017).
Using the Find_Orb orbital determination software by Bill Gray,10 we fit an orbit to the observations in Table A1, using the eight planets and the Moon as perturbers, and including the effects of solar radiation pressure (e.g., G. Fedorets et al. 2020; D. Jewitt 2024). Our orbital fit results in estimates of the heliocentric and geocentric semimajor axis, a; eccentricity, e; inclination, i; ascending node, Ω; argument of perihelion, ω; mean anomaly, M; and the area-to-mass ratio (AMR) as a measure of the effect of solar radiation pressure on the orbit of 2024 PT5.
Table 1. Orbital Elements of 2024 PT5 Based on Observations Collected between 2024 August 7 UTC and 2020 October 24 UTC
| Heliocentric Elements | |
|---|---|
| Epoch (JD) | 2460607.5 |
| Time of perihelion, Tp (JD) | 2460638.2598770 ± (5.58 × 10⁻⁵) |
| Semimajor axis, a (au) | 1.0121184340 ± (2.03 × 10⁻⁸) |
| Eccentricity, e | 0.021315140 ± (3.89 × 10⁻⁸) |
| Perihelion, q (au) | 0.9905449810 ± (3.01 × 10⁻⁸) |
| Aphelion, Q (au) | 1.0336918860 ± (5.53 × 10⁻⁸) |
| Inclination, i (deg) | 1.5167380 ± (4.7 × 10⁻⁶) |
| Ascending node, Ω (deg) | 304.494733 ± (9.0 × 10⁻⁵) |
| Argument of perihelion, ω (deg) | 117.54969 ± (1.0 × 10⁻⁴) |
| Mean Anomaly, M (deg) | 330.225693 ± (5.4 × 10⁻⁵) |
| Geocentric Elements | |
| Epoch (JD) | 2460607.5 |
| Time of perihelion, Tp,g (JD) | 2460429.570191 ± (2.87 x 10⁻⁴) |
| Semimajor axis, ag (au) | 0.017623959 ± (1.09 x 10⁻⁷) |
| Eccentricity, eg | 0.61405662 ± (2.04 x 10⁻⁶) |
| Perihelion, qg (au) | 0.006801850 ± (7.1 x 10⁻⁸) |
| Aphelion, Qg (au) | 0.028446068 ± (1.56 x 10⁻⁷) |
| Inclination, ig (deg) | 105.640940 ± (4.0 x 10⁻⁵) |
| Ascending node, Ωg (deg) | 302.876944 ± (3.40 x 10⁻⁴) |
| Argument of perihelion, ωg (deg) | 277.668305 ± (3.9 x 10⁻⁴) |
| Mean Anomaly, Mg (deg) | 129.9004 ± (1.0 x 10⁻³) |
| AMR (m2 kg−1) | 7.02 x 10⁻⁵ ± (2.05 x 10⁻⁵) |
| Absolute Magnitude, H | 28.64 ± (0.04) |
Note. The orbital elements are shown for the Julian Date (JD) using the software Find_Orb by Bill Gray. The 1σ uncertainties are given in parentheses.
Download table as: ASCIITypeset image
The heliocentric and geocentric orbital parameters and AMR (a, e, i, Ω, ω, M, and AMR) parameter estimates of the least-square orbital fit using the observations of 2024 PT5 is shown in Table 1. The mean observed-minus-computed residual from the least-square fit using the seven-parameter fit is 0 33. A complete list of the observed-minus-computed residuals in the along track, Xres., and cross-track, Yres., are shown in Table A1. The geocentric eccentricity eg of 2024 PT5 was ~1.05 on 2024 September 27 UTC, the date of the Gemini N observations, indicating that 2024 PT5 was on a hyperbolic trajectory with respect to Earth. Its AMR of 7.02 ± 2.05 × 10⁻⁵ m2 kg−1 is comparable to other small asteroids with measured AMRs (e.g., M. Micheli et al. 2013; R. Jedicke et al. 2018).
Table 2. Summary of 2024 PT5 Photometry Taken on 2024 September 27 UTC
| Date | Filter | Exp. | m |
|---|---|---|---|
| (MJD UTC) | (s) | ||
| (1) | (2) | (3) | (4) |
| 60580.2477197 | g | 75 | 23.61 ± 0.06 |
| 60580.2489847 | g | 75 | 23.53 ± 0.06 |
| 60580.2543947 | g | 75 | 23.35 ± 0.05 |
| 60580.2556186 | g | 75 | 23.39 ± 0.05 |
| 60580.2568848 | g | 75 | 23.43 ± 0.05 |
| 60580.2581092 | g | 75 | 23.55 ± 0.06 |
| 60580.2635833 | g | 75 | 23.53 ± 0.05 |
| 60580.2648080 | g | 75 | 23.55 ± 0.05 |
| 60580.2661196 | g | 75 | 23.45 ± 0.05 |
| 60580.2728218 | g | 75 | 23.48 ± 0.05 |
| 60580.2740833 | g | 75 | 23.58 ± 0.05 |
Note. Column (1): observation date corrected for light travel time; column (2): Gemini N/GMOS filter; column (3): exposure time; column (4): per-filter apparent magnitude with 1σ uncertainties
Download table as: ASCIITypeset image
The orbital trajectory of 2024 PT5 between 2024 June and 2025 April is shown in Figure 3 based on values from JPL Horizons.11 The eg of 2024 PT5 decreased below 1.0 at around 2024 September 29 23:40 UTC, as indicated by the red portion of the trajectory of 2024 PT5 in the top and bottom panels of Figure 3. The capture of 2024 PT5 by the Earth–Moon system ended at around 2024 November 25 18:20, making it the most short-lived minimoon known, having been captured by the Earth–Moon system for only ~60 days. Additionally, 2024 PT5 did not make a complete revolution around the Earth–Moon barycenter, unlike previous minimoons such as 2006 RH120 (T. Kwiatkowski et al. 2008; M. Granvik et al. 2012) and 2020 CD3.
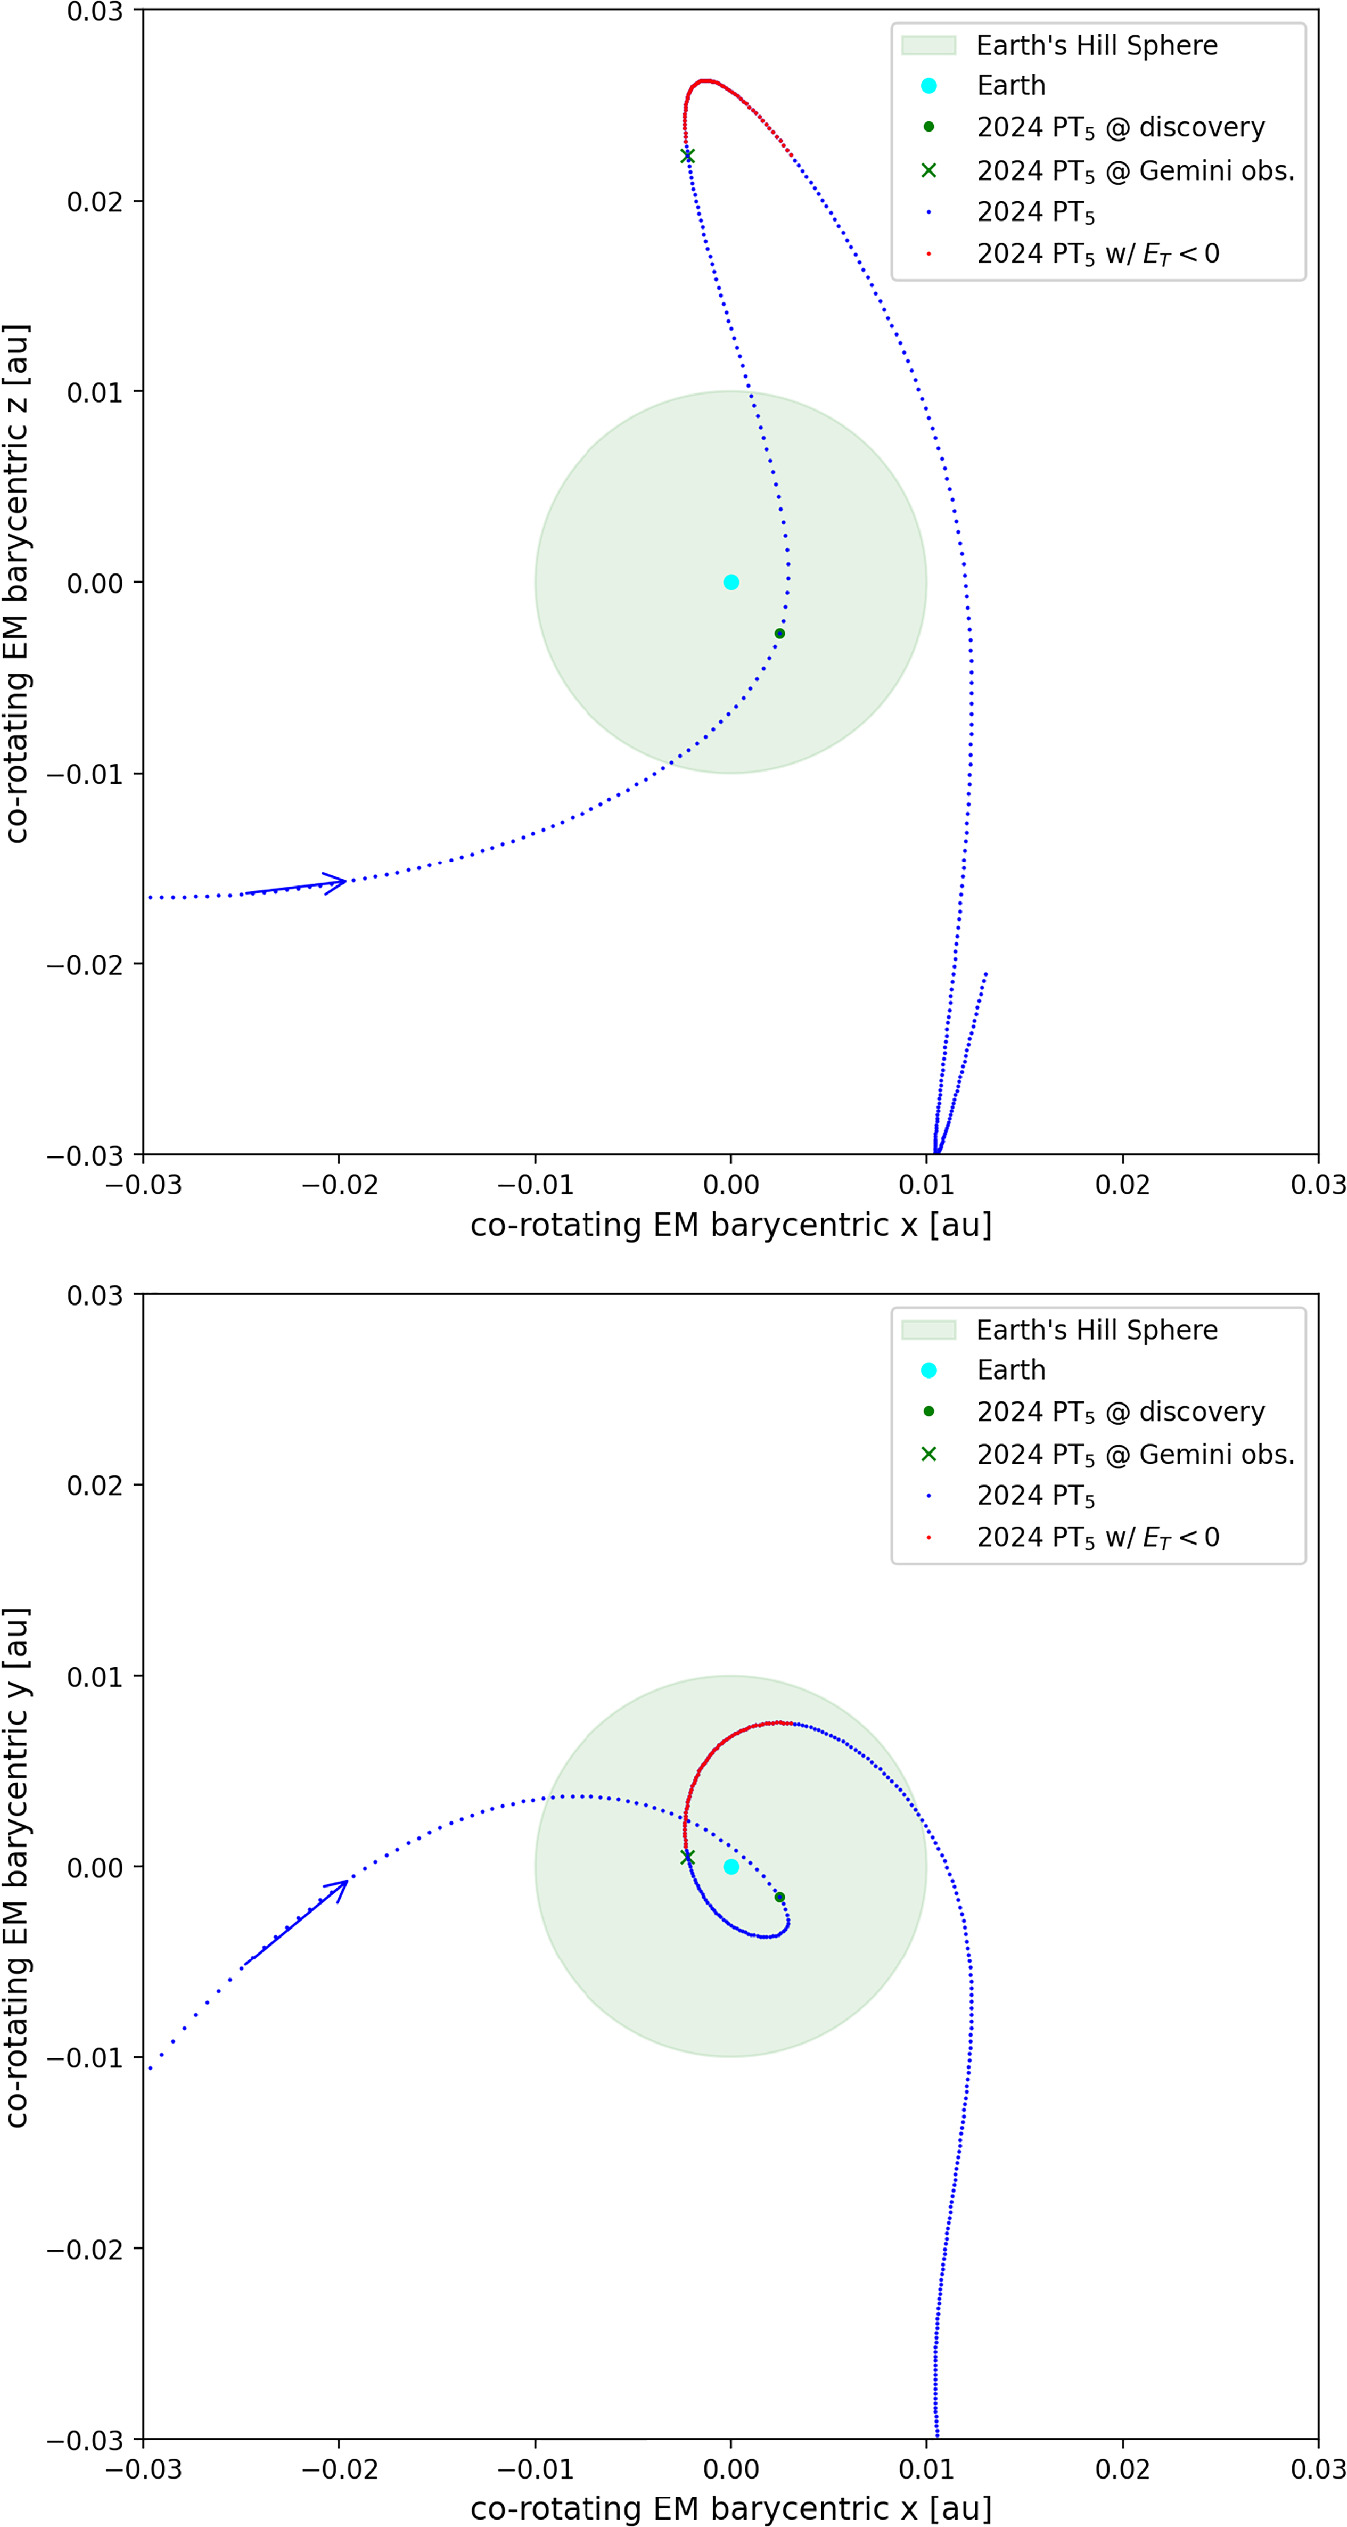
Figure 3. Top panel: side view of the Earth corotating frame orbital trajectory of 2024 PT5 as it enters and leaves the Earth–Moon system between 2024 June and 2025 April in Cartesian Earth–Moon barycentric x- and z-coordinates. The daily position of 2024 PT5 is represented as blue points except the portion of its trajectory when it had eg < 1 plotted in red. The position of the Earth is plotted with a cyan circle. The circular green-shaded region indicates the Hill sphere of Earth. The position of 2024 PT5, when it was discovered, is marked by a green circle, and the position of 2024 PT5 when Gemini observed it is marked with a green X. A blue arrow indicates the direction of motion of 2024 PT5 along its orbital path. Bottom panel: the same as the top panel, except in Cartesian Earth–Moon barycentric x- and y-coordinates.
Download figure:
Standard image High-resolution image3.2. Photometry and Spectral Classification
The photometry of 2024 PT5 was measured using a 0 81 aperture and then subtracting from it the median contribution from the sky background within a 1
 3–2
 4 annulus. The g, r, i, and Z photometry were calibrated using solar analog stars from the Pan-STARRS catalog (K. C. Chambers et al. 2016). The Pan-STARRS catalog magnitudes of the solar analog stars were transformed to SDSS magnitudes using the conversions from J. L. Tonry et al. (2012). We obtained brightnesses of g = 23.52 ± 0.03, r = 22.95 ± 0.03, i = 22.66 ± 0.03, and Z = 22.93 ± 0.05. The multiband colors of 2024 PT5 are g − r = 0.58 ± 0.05, r − i = 0.29 ± 0.04, and i − z = −0.27 ± 0.06. The g − i color and spectra slope are 0.87 ± 0.04 and 9.5 ± 1.1%/100 nm.
Using the definition of a* from Ž. Ivezić et al. (2001), a* = (0.89 (g − r)) + (0.45 (r − i)) − 0.57, as an indicator of spectral slope, we find a* = 0.07 ± 0.04 as plotted versus i − z(Z) in Figure 4. Overall, 2024 PT5 has a* and i − z similar to S types, which have a* = 0.12 ± 0.03 and i − z = −0.08 ± 0.07 on average, and some V-type asteroids, which have a* = 0.1 ± 0.11 and i - z = −0.46 ± 0.04 on average, as plotted in Figure 4. 2024 PT5 is redder compared with a smaller i − z color compared to C-type asteroids, which have on average an a* = −0.09 ± 0.02 and i − z = 0.02 ± 0.03, and the Sun, which has an a* = −0.13 and i − z = 0.03.

Figure 4. a* vs. i − z(Z) colors of 2024 PT5 plotted with a* vs. i − z colors of C-, S-, and V-type asteroids from Ž. Ivezić et al. (2001) and M. Jurić et al. (2002); active comets (M. Solontoi et al. 2012); Kuiper Belt objects (E. O. Ofek 2012); and bulk lunar rock samples (P. J. Isaacson et al. 2011). The colorization scheme of data points as a function of a* and i − z is adapted from Ž. Ivezić et al. (2002), where blue symbol colors correspond to C-type asteroids, red symbol colors correspond to S-type asteroids, and green symbol colors correspond to V-type asteroids. We note that in this case, the measured Z magnitude of 2024 PT5 is plotted as a substitute for its z magnitude, i − z. The a* and i − z range of average S-, V-, and C-type asteroids are shown computed from the average spectra from F. E. DeMeo et al. (2009).
Download figure:
Standard image High-resolution imageWe compute the spectral reflectance of 2024 PT5 by dividing its flux per g, r, i, and Z filters obtained by the flux of a solar analog in a corresponding filter, normalizing it to a wavelength of 550 nm. The normalized reflectivity spectrum of 2024 PT5 shown in Figure 5 is similar to the spectra of S- and V-type asteroids (S. J. Bus & R. P. Binzel 2002; F. E. DeMeo et al. 2009) with a red slope between 470 and 770 nm and a decrease in reflectance near 880 nm. The spectrum of 2024 PT5 is also similar to some bulk basaltic lunar rock samples consisting of pyroxene minerals (P. J. Isaacson et al. 2011). For a thorough comparison, we compute the χ2 statistic for the spectrum of 2024 PT5 compared to the spectrum of 19 different asteroid types including S-complex asteroid types (S, Sq, Sv, Q), C-complex types (B, C, Cg, Cgh), X-complex types (X, Xc, Xe, Xk, Xn), and other assorted types (A, D, K, L, O, R, V) from S. J. Bus & R. P. Binzel (2002) and F. E. DeMeo et al. (2009). We find the closest match is to lunar rock with a reduced χ2 of 2.76 and Sv-type asteroids with a reduced χ2 of 3.75. By comparison, the comparison with V-type spectra results in a reduced χ2 of ~12.84.
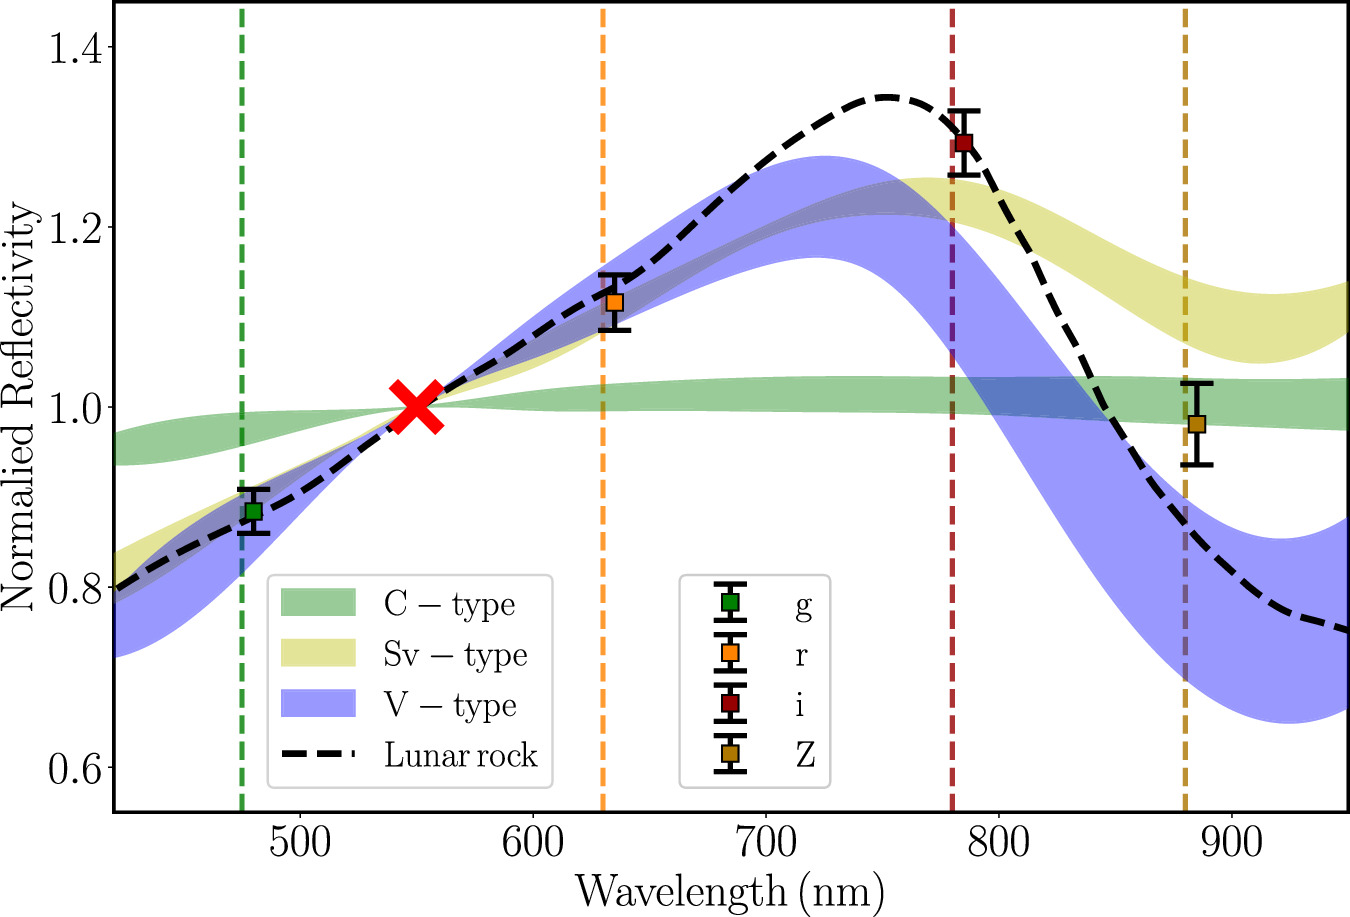
Figure 5. Reflectance photometric spectrum of 2024 PT5 consisting of g, r, i, and Z observations of 2024 PT5 on 2024 September 27 UTC. The λeff locations of the g, r, i, and Z filters have been plotted as vertical dashed lines. The data points for the normalized reflectivity of 2024 PT5 have been offset slightly from their location in the wavelength direction. The error bars on the spectrum data points correspond to 1σ uncertainty. The spectrum has been normalized to unity at 550 nm, as indicated by the red cross. The spectral range of S-, V- and C-type asteroids from the Bus–DeMeo asteroid taxonomic catalog (F. E. DeMeo et al. 2009) are overplotted with the V-type spectrum most closely resembling the spectra of 2024 PT5. The average spectrum of Apollo program coarse bulk lunar rock samples is plotted for reference (P. J. Isaacson et al. 2011).
Download figure:
Standard image High-resolution imageWe use our g- and r-magnitude measurements of 2024 PT5 to estimate an equivalent V-band brightness of 23.2 ± 0.04 on 2024 September 7. We calculated the H magnitude of 2024 PT5 using our estimated V magnitude and the phase function from an equation from E. Bowell et al. (1988):

where rh is the 1.000 au heliocentric distance, Δ is its geocentric distance of 0.0225 au, and α is its phase angle of 84 4 of 2024 PT5 on 2024 September 27 UTC. G is the phase coefficient that we use for the value of 0.2, the average value for S-type asteroids (P. Vereš et al. 2015). Φ1(α) and Φ2(α) are the basis functions normalized at α = 0° described in E. Bowell et al. (1988). We obtain H = 28.64 ± 0.04 but caution that the uncertainty on H is underestimated due to the lack of information about the phase function.
3.3. Lightcurve, Periodicity, and Axial Ratio
We use the g-filter data to search for periodic variations in the time series brightness of 2024 PT5. The measured time series photometric values in the individual g images are presented in Table 2 and plotted in the top panel of Figure 6. There are variations as large as ~0.2–0.25 magnitudes in the brightness of 2024 PT5, significantly larger than the ~0.01 mag variations seen in Skyprobe data for 2024 September 27 UTC12 and the ~0.05 mag uncertainty of the individual g-filter data points.
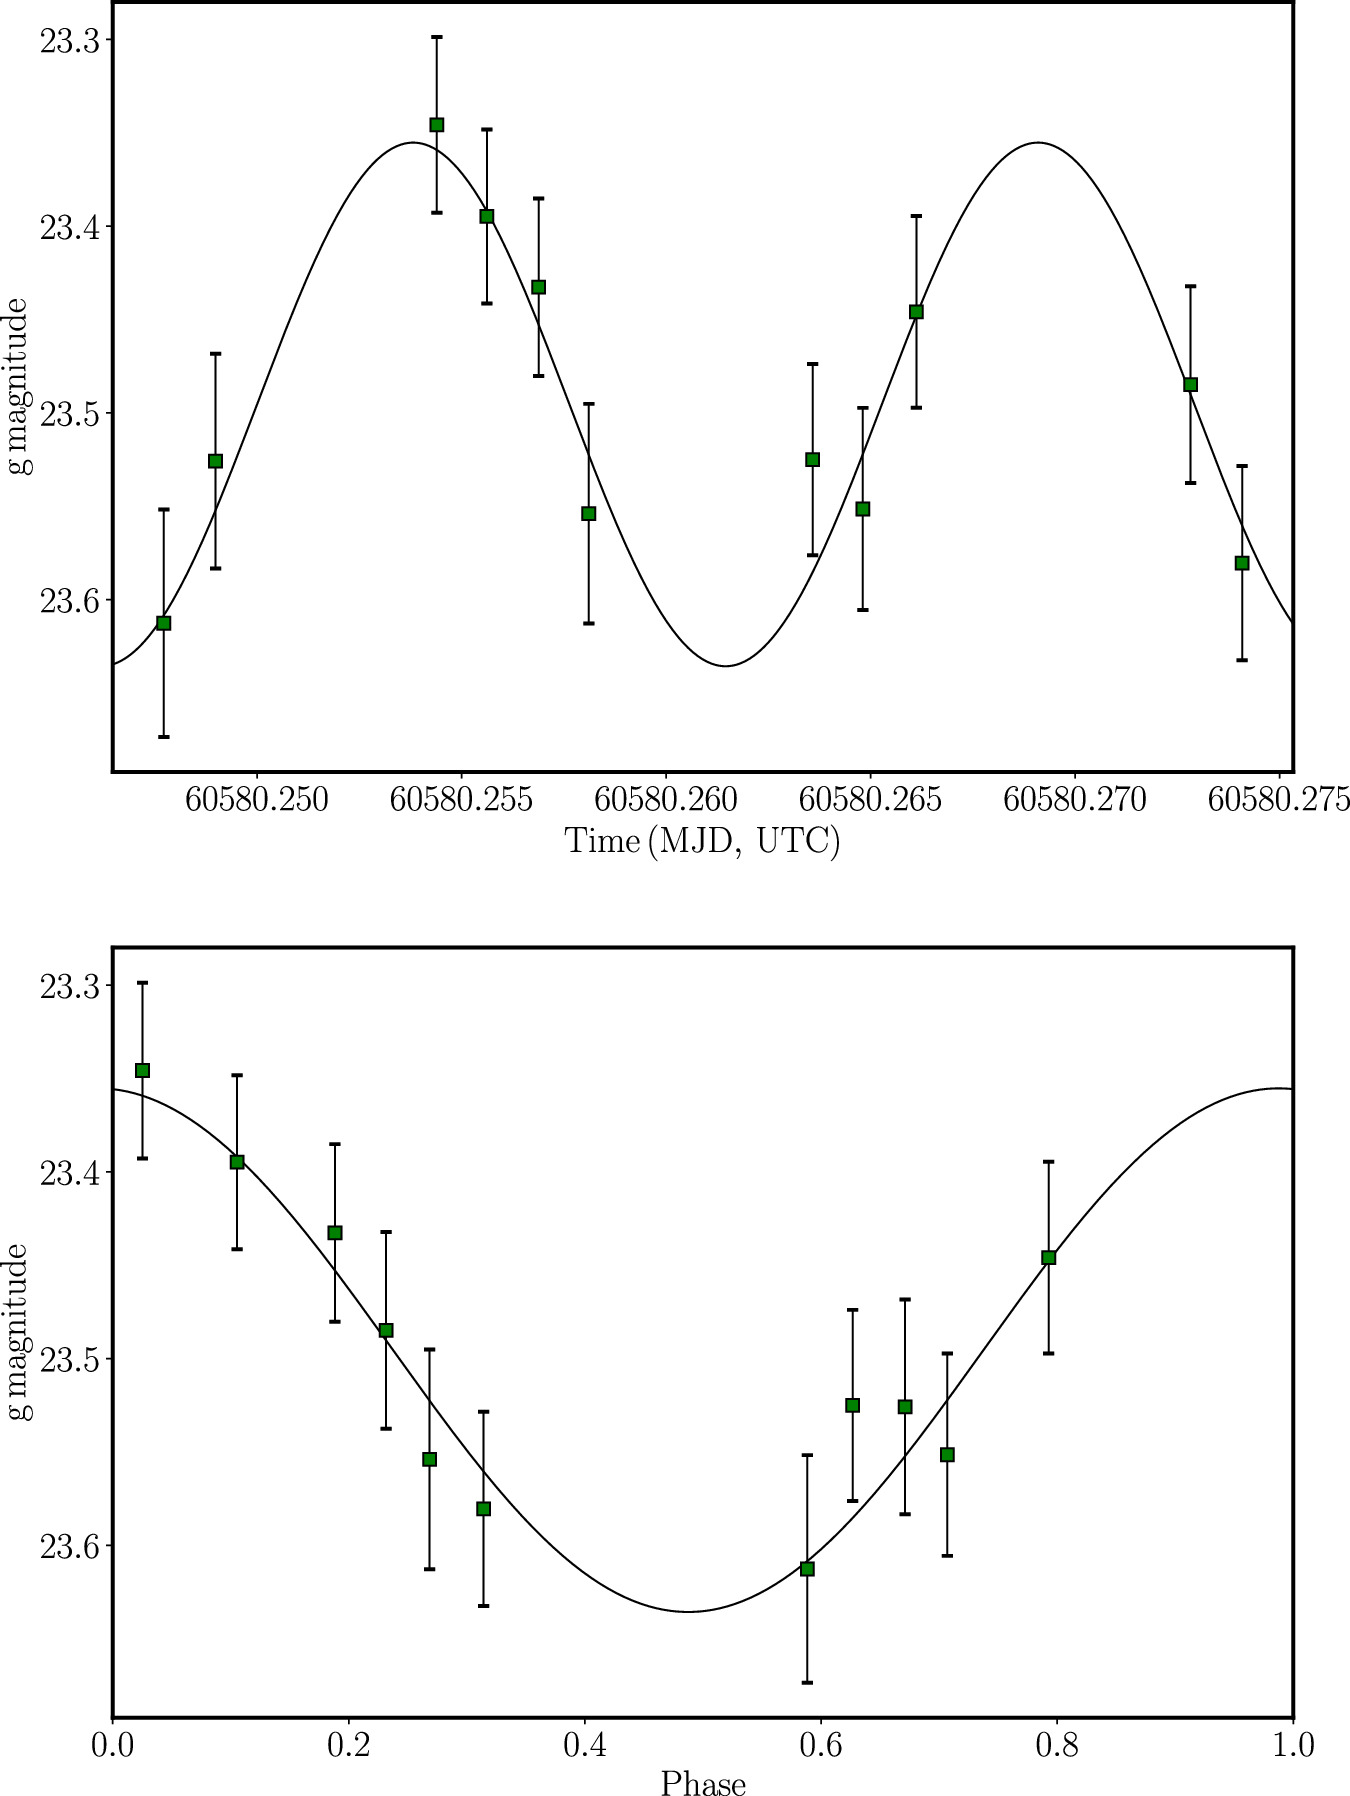
Figure 6. Top panel: g-filter lightcurve from 2024 September 27 GMOS observations of 2024 PT5. The error bars on the data points are equal to their 1σ photometric uncertainties. A model lightcurve is plotted in black with a double-peaked period of ~2600 s and amplitude of 0.28 mag. Bottom panel: phased g-filter lightcurve data of 2024 PT5 using a lightcurve period of ~1300 s and amplitude of 0.28 mag.
Download figure:
Standard image High-resolution imageThe Lomb–Scargle periodogram (N. R. Lomb 1976) was applied to the time series g-filter data, as seen in the top panel of Figure 7. We take a similar approach as B. T. Bolin et al. (2024) to estimate the uncertainty on the determined period by removing  data points from the time series lightcurve and repeating our periodogram estimation of the lightcurve period 10,000 times, resulting in a central value of ~1317 s and a 1σ uncertainty estimate of ~227 s. We apply phase-dispersion minimization analysis to our data (R. F. Stellingwerf 1978) as an independent check of the Lomb–Scargle results, obtaining a result of ~1150 s as seen in the bottom panel of Figure 7, comparable with the lightcurve period estimate. These period estimates imply that 2024 PT5 has a double-peaked rotation period of ~2600 ± 500 s.
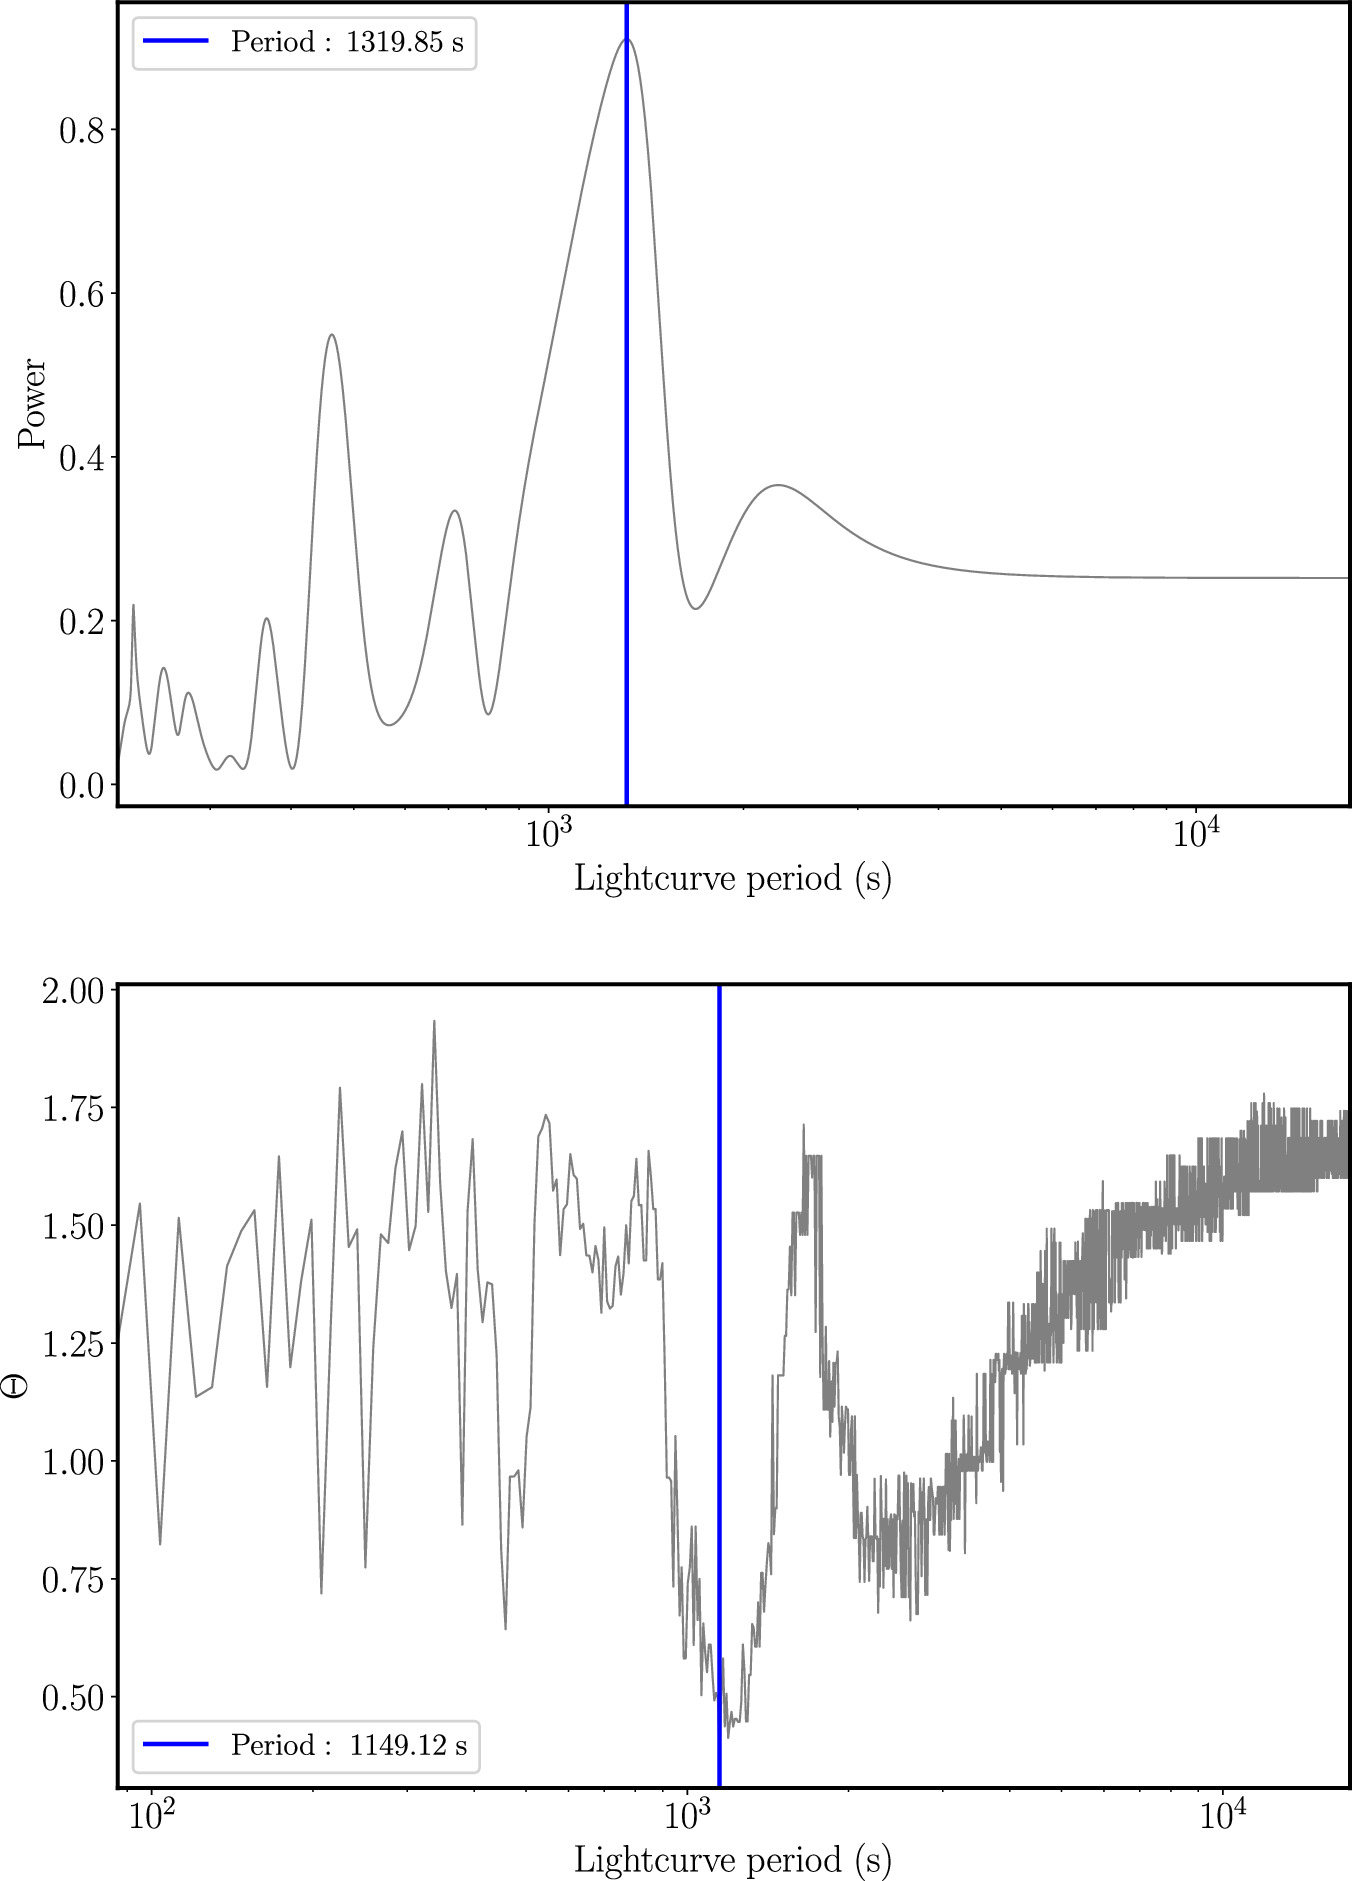


Figure 7. Top panel: Lomb–Scargle periodogram of lightcurve period vs. spectral power (N. R. Lomb 1976) for the g-filter data from the 2024 September 27 UTC Gemini N/GMOS observations. A peak in the power is located at single-peaked lightcurve period of 1320 s. Bottom panel: phase-dispersion minimization analysis of lightcurve rotation period vs. Θ metric (R. F. Stellingwerf 1978). The Θ metric is minimized at single-peaked rotation periods of 1150 s similar to the 1320 ± 227 s period found with the Lomb–Scargle periodogram.
Download figure:
Standard image High-resolution image
Using the observed amplitude of the g-filter lightcurve of 0.28 ~ 0.07, we estimate the rough shape of 2024 PT5, assuming it is a prolate triaxial ellipsoid with dimensions a:b:c, where b ≥ a ≃ c, in rough agreement with the shapes of other asteroids inferred from lightcurve inversion (e.g., J. Hanuš et al. 2016, 2018). The ratio between b and a is described by b/a = 100.4A, where A is the peak-to-trough lightcurve amplitude (R. P. Binzel et al. 1989) and assuming a ≃ c, resulting in a b/a ~ 1.3. However, the axial ratio may be exaggerated due to the effect of observing at a large phase angle of ~84° on 2024 September 27 UTC (V. Zappala et al. 1990) as has been suggested for lightcurve observations of other small solar system objects (e.g., B. T. Bolin et al. 2018).
4. Discussion and Conclusions
The spectrum of 2024 PT5 is similar to asteroids from the S complex, as well as some samples of lunar rock, which suggests that it may either originate from the inner Main Belt, where the majority of S-type asteroids are found (F. E. DeMeo & B. Carry 2014), or as a piece of debris resulting from an impact on the moon ejected into an Earth-similar orbit (B. J. Gladman et al. 1995). We can use the orbital information of 2024 PT5 as an additional constraint on its likely origin and physical properties through comparison with dynamical models describing the escape of asteroids from the Main Belt into the NEO population (M. Granvik et al. 2017; D. Nesvorný et al. 2023).
We use the visible albedos, pv, measured for S-complex and lunar rock samples to estimate the albedo of 2024 PT5. S-complex asteroids have an albedo of ~0.21 (C. A. Thomas et al. 2011), while lunar rock has an albedo of ~0.14 (G. Matthews 2008). As an independent albedo estimate, we compare the orbit of 2024 PT5 with the NEOMOD3 population model, suggesting its most likely source is the ν6 resonance located near the inner edge of the Main Belt with an 88.4% probability. The next most likely location, with a 11% chance of 2024 PT5 coming from it, is the 3:1 mean motion resonance located in the Main Belt at 2.5 au. Weighing the NEO albedo model (A. Morbidelli et al. 2020) according to these source probabilities for 2024 PT5 results in a predicted pv of ~0.21. We assume a conservative albedo estimate of ~0.1 corresponding to the scatter in albedo measurements for small S-complex asteroids (M. Delbo et al. 2003; R. P. Binzel et al. 2004).
We use the albedo estimate and H magnitude of 2024 PT5 to determine the diameter, D, of 2024 PT5 using the equation  from H. N. Russell (1916), arriving at D = 5.4 ± 1.2 m. Combining this diameter calculation with the AMR determined from our orbital fit, we can estimate a bulk density for 2024 PT5 of 3.9 ± 2.1 g cm−3 comparable with achondritic basaltic meteorites (R. J. Macke et al. 2011) and small asteroids with AMR measurements (M. Mommert et al. 2014). If we use the mean albedo of lunar rock samples of 0.14, we obtain a diameter of 6.0 ± 1.7 m and a bulk density of 3.6 ± 2.4 g cm−3. This density estimate is comparable to the density of some lunar rock samples (W. S. Kiefer et al. 2012). Using these density estimates, the mass of 2024 PT5 is ~105 kg. With the comparison of its physical properties determined from our observations to the physical properties of asteroids and lunar samples, we conclude that the physical properties of 2024 PT5 inferred from our observations is compatible with an inner Main Belt or lunar ejecta origin with the spectral data favoring the latter origin.
Acknowledgments
This study is based on observations obtained at the international Gemini Observatory, a program of NSF's NOIRLab, which is managed by the Association of Universities for Research in Astronomy (AURA) under a cooperative agreement with the National Science Foundation on behalf of the Gemini Observatory partnership.
Gemini Observatory is located on Maunakea, land of the Kānaka Maoli people, and a mountain of considerable cultural, natural, and ecological significance to the indigenous Hawaiian people. The authors wish to acknowledge the importance and reverence of Maunakea and express gratitude for the opportunity to conduct observations from the mountain.
Facilities: ATLAS - , Gemini:Gillett - Gillett Gemini North Telescope
Appendix
The appendix includes a list (Table A1) of the astrometry used in this manuscript.
Table A1. Summary of Astrometry from Observations Taken by Gemini N/GMOS and Other Observatories between 2024 August 7 UTC and 2024 October 24 UTC
| Date | R.A. | Decl. | σR.A. | σDecl. | Xres. | Yres. | Obs. Code |
|---|---|---|---|---|---|---|---|
| (UTC) | (arcsec) | (arcsec) | (arcsec) | (arcsec) | |||
| (1) | (2) | (3) | (4) | (5) | (6) | (7) | (8) |
| 2024 8 7.883302 | 18 57 04.97 | −55 56 00.24 | 1 | 1 | 0.42 | −0.3 | M22 |
| 2024 8 7.886527 | 18 56 56.059 | −55 53 40.85 | 1 | 1 | 0.3 | −0.04 | M22 |
| 2024 8 7.892126 | 18 56 40.711 | −55 49 37.52 | 1 | 1 | 0.37 | 0.05 | M22 |
| 2024 8 7.903165 | 18 56 10.685 | −55 41 31.85 | 1 | 1 | −0.64 | −0.03 | M22 |
| 2024 8 12.060358 | 18 14 04.848 | −09 25 00.44 | 1 | 1 | 0.13 | 0.29 | W68 |
| 2024 8 12.065029 | 18 13 59.82 | −09 22 24.35 | 1 | 1 | 0.27 | −0.4 | W68 |
| 2024 8 12.070721 | 18 13 53.688 | −09 19 13.58 | 1 | 1 | 0.28 | −0.88 | W68 |
| 2024 8 12.105146 | 18 13 17.028 | −08 59 51.4 | 1 | 1 | −0.23 | 0.13 | W68 |
| 2024 8 12.319011 | 18 12 25.265 | −07 31 12.58 | 1 | 1 | 0.01 | −0.43 | T08 |
Note. Columns (1): UTC observation date at the midpoint of the exposure; column (2): R.A.; column (3): decl.; column (4): uncertainty in R.A.; column (5): uncertainty in decl.; column (6): observed-minus-computed residual in the X-direction; column (7): observed-minus-computed residual in the Y-direction; column (8): MPC Observatory code. Table A1 is published in its entirety in the machine-readable format. A portion is shown here for guidance regarding its form and content.
A machine-readable version of the table is available.
Download table as: Machine-readable (MRT)Typeset image
Footnotes
- 8
- 9
- 10
- 11
- 12