
વર્ણન
Many times, while maintaining a WordPress website, we need to find basic statistics like user registrations or user comments and also compare them with different years. It can generate Bar-Diagram or Line-Diagram for different years and different months for the no of users registrations and no of users comments posted in the website.
This plugin is very light-weight, just 10kb, and it uses Google Charts API only where it is needed.
સ્ક્રીનશોટ

Mini Statistics admin page showing list of available statistics. 
Oviewview statistics of User Registrations. 
Yearly User Registration statistics in Column Chart/Bar Diagram. 
Yearly User Registration statistics in Line Diagram. 
Oviewview statistics of User Comments. 
Yearly User Comments statistics in Column Chart/Bar Diagram. 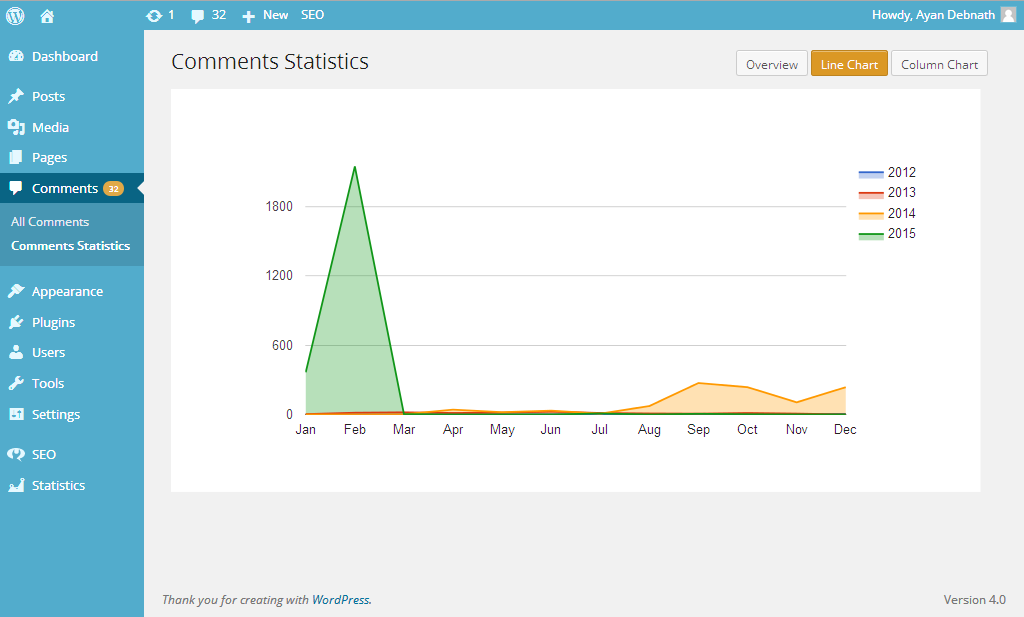
Yearly User Comments statistics in Line Diagram.
સ્થાપન
- Unzip mini-statistics.zip and upload the mini-statistics directory to the
/wp-content/plugins/directory. - Activate the plugin through the ‘Plugins’ menu in WordPress.
સમીક્ષાઓ
આ પ્લગઇન માટે કોઈ સમીક્ષાઓ નથી.
ફાળો આપનાર & ડેવલપર્સ
“Mini Statistics” ને તમારી ભાષામાં અનુવાદ કરો.
વિકાસમાં રસ ધરાવો છો?
કોડ બ્રાઉઝ કરો, જોવોઅસ્વીએન રેપોઝિટરીમાંથી,અથવા સબ્સ્ક્રાઇબ કરોડેવલપમેન્ટ દ્વારાઆરઅસઅસ.
ચેન્જલૉગ
1.0.3
- Added Overview Chart as Default.
- Better design for Line Charts.
1.0.2
- Small PHP-Notice error fixing. Special thanks to Ayan Debnath.
1.0.1
- Small bug fixing. Special thanks to Kishore Chowdhury.
1.0.0
- 1st Release version.