stat_contour fill - 2 issues #1066
Description
Hello everyone,
I have been using ggplot2 for quite sometime now it's a great library! But I am stuck on some (known from what I have searched) issues of stat_contour.
- When I set geom="polygon" the levels that are not fully closed are not filled correctly.
- Higher levels cover/hide the lower levels.
Straight to a simple example to show you what I mean:
Creating the data
library(ggplot2)
x = seq(-1, 1, length.out = 100)
y = x
R = expand.grid(x, y)
dim(R)
names(R) = c("x", "y")
R$z = R$x^2 + R$y^2
head(R)
Ploting contour
ggplot(R, aes(x = x, y = y, z = z)) + stat_contour()

Ploting filled contour by setting geom="polygon"
ggplot(R, aes(x = x, y = y, z = z)) + stat_contour(geom="polygon")

In order to see what is filled correctly and what is not
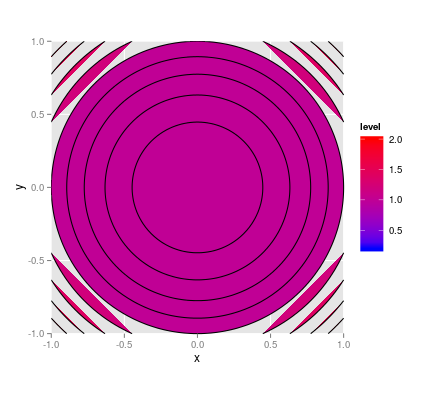
ggplot(R, aes(x = x, y = y, z = z, fill=..level..)) +
stat_contour(geom="polygon") +
stat_contour() +
scale_fill_gradient(low = "blue", high = "red") +
coord_map(xlim=c(-1,1),ylim=c(-1,1))
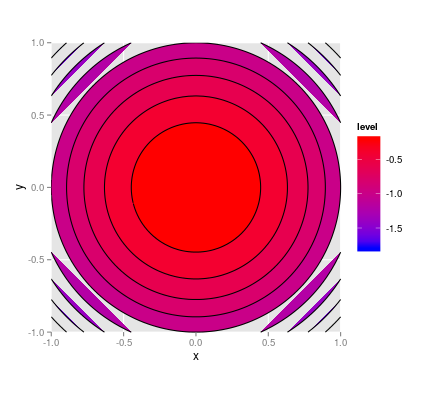
And if we reverse the values of R$z we can display the inner/hidden levels (multiply *-1)
ggplot(R*-1, aes(x = x, y = y, z = z, fill=..level..)) +
stat_contour(geom="polygon") +
stat_contour() +
scale_fill_gradient(low = "blue", high = "red") +
coord_map(xlim=c(-1,1),ylim=c(-1,1))
The first problem is somehow fixed (not completely) by expanding my grid with the same values that has in each side. Something like this:
R_fill <- subset(R, x==1 | x==-1 | y==1 | y==-1)
R_fill[R_fill$x==1,]$x=5
R_fill[R_fill$x==-1,]$x=-5
R_fill[R_fill$y==1,]$y=5
R_fill[R_fill$y==-1,]$y=-5
R_fill <- rbind(R_fill,R)
ggplot(R_fill*-1, aes(x = x, y = y, z = z, fill=..level..)) +
stat_contour(geom="polygon") +
stat_contour() +
scale_fill_gradient(low = "blue", high = "red") +
coord_map(xlim=c(-1,1),ylim=c(-1,1))

To sum up, (1) every level that is higher than 1 is not filled correctly since the level line is not closed on the edges. So whenever the level is not closed, ggplot is forcing a closure by connecting the two edges of the semi-circles. Maybe the only way to correct the above problem is to handle and plot the levels in stat_contour as polygons with certain coordination. Can I somehow obtain the exact point position that belong to each contour line? If I could then I would be able to plot them as polygons and set a certain box around the region I want to plot and "close" the "un-closed" levels in order to be filled correctly.
And (2) since ggplot (to my understanding) is plotting lower to higher levels, the lower levels are obscured. I have no idea how this could be fixed, since some datasets contain regions of lower values around higher levels.
I don't know how hard is to tackle and correct these problems since I have no experience on the ggplot code. It would be really useful if stat_contour acted as filled.contour, since ggplot2 has some many possibilities. So I would like to hear your thoughts and your suggestions.
Thank you in advance,
Thanos