precision_recall_curve() is not returning the full curve at high recall #23213
Description
Describe the bug
precision_recall_curve() is truncating the curve once it reach maximum recall 1, that is not nice because it is removing relevant information.
Indeed, once you reach the first threshold value that gives a recall of 100%, then if you continue to increase the threshold, the recall will stay at 100%, but the precision will decrease until it reach the class balance, i.e. when all the points are below threshold.
This is due to the following lines in precision_recall_curve():
# stop when full recall attained
# and reverse the outputs so recall is decreasing
last_ind = tps.searchsorted(tps[-1])
sl = slice(last_ind, None, -1)
return np.r_[precision[sl], 1], np.r_[recall[sl], 0], thresholds[sl]
scikit-learn/sklearn/metrics/_ranking.py
Line 868 in 24106c2
There is no reason that I can understand why "stop when full recall attained".
Side remark: I'm raising and fixing this because we are working on a method to get the confidence band for precision recall curve, and we noticed that these important points are missing. Then for every point of the curve we compute an estimation of the sampling uncertainty of the (test) dataset. We are soon going to publish a paper and a MR for model metric uncertainty.
Steps/Code to Reproduce
from sklearn.datasets import make_classification
from sklearn.linear_model import LogisticRegression
from sklearn.metrics import precision_recall_curve
import numpy as np
import matplotlib.pyplot as plt

X, y_true = make_classification(n_samples=1000, n_classes=2, random_state=1)
model = LogisticRegression(solver='lbfgs')
model.fit(X, y_true)
y_prob = model.predict_proba(X)[:, 1]

precision, recall, thresholds = precision_recall_curve(y_true, y_prob)

# Plot precision-recall curve
fig, ax = plt.subplots(figsize=(10, 7.5))
ax.plot(recall, precision, label='classifier')  # or adjust_lightness
ax.set_ylim((0.4, 1.05))
plt.axhline(y=y_true.mean(), color='r', linestyle='-', label='max recall')
plt.legend()
ax.set_xlabel('Recall (True Positive Rate)')
ax.set_ylabel('Precision (1-FDR)')
ax.set_title(f'Precision-Recall Curve')
Expected Results
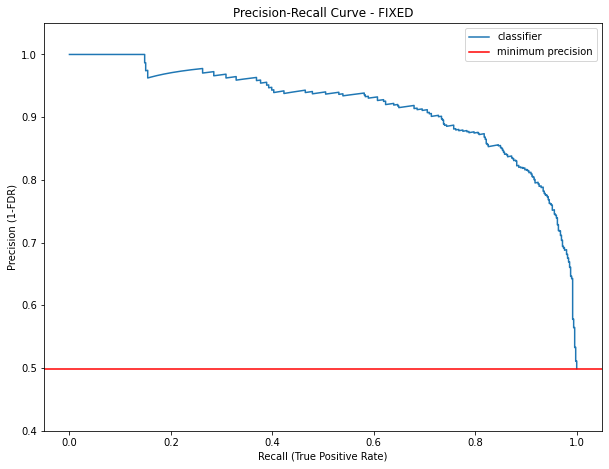
Actual Results
See at high recall the missing part of the curve

Versions
System:
    python: 3.8.13 (default, Apr 16 2022, 13:03:27)  [Clang 13.1.6 (clang-1316.0.21.2.3)]
executable: /Users/user/.pyenv/versions/pyenv38/bin/python
   machine: macOS-12.3.1-x86_64-i386-64bit

Python dependencies:
          pip: 22.0.4
   setuptools: 56.0.0
      sklearn: 1.0.2
        numpy: 1.22.3
        scipy: 1.8.0
       Cython: None
       pandas: 1.4.2
   matplotlib: 3.5.1
       joblib: 1.1.0
threadpoolctl: 3.1.0

Built with OpenMP: True