CartesianAxis on charts with large datasets causes performance issues with the default interval #1465
Description
Do you want to request a feature or report a bug?
Bug
What is the current behavior?
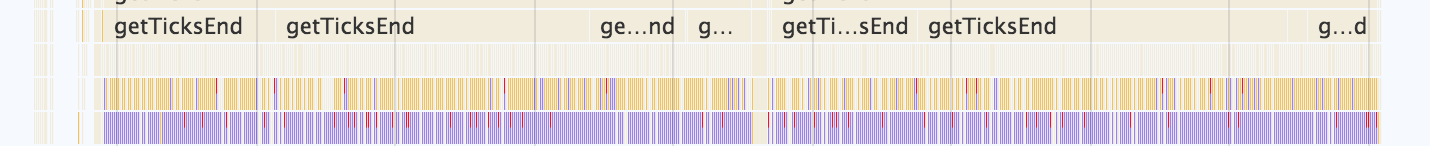
With a large dataset (~10000 items) rendering on a simple line chart, adding an XAxis with the default interval (preserveEnd) results in a chart taking several seconds to render (depending on cpu). Drilling into the perf you can see that getTicksEnd is the blocking function (more specifically getStringSize which is forcing reflow)
If the current behavior is a bug, please provide the steps to reproduce and if possible a minimal demo of the problem via https://jsfiddle.net or similar (template: http://jsfiddle.net/ndLhnegs/).
goto : https://jsfiddle.net/dbwnv9fp/15/ and "run" then add interval={1000} to the XAxis and notice the speed increase.
What is the expected behavior?
adding an xaxis should not increase the render time by 4-5x for large datasets.
Which versions of Recharts, and which browser / OS are affected by this issue? Did this work in previous versions of Recharts?
recharts 1.1.0 - chrome latest (osx and windows).