Customisable chart range #45
Description
Is your feature request related to a problem?
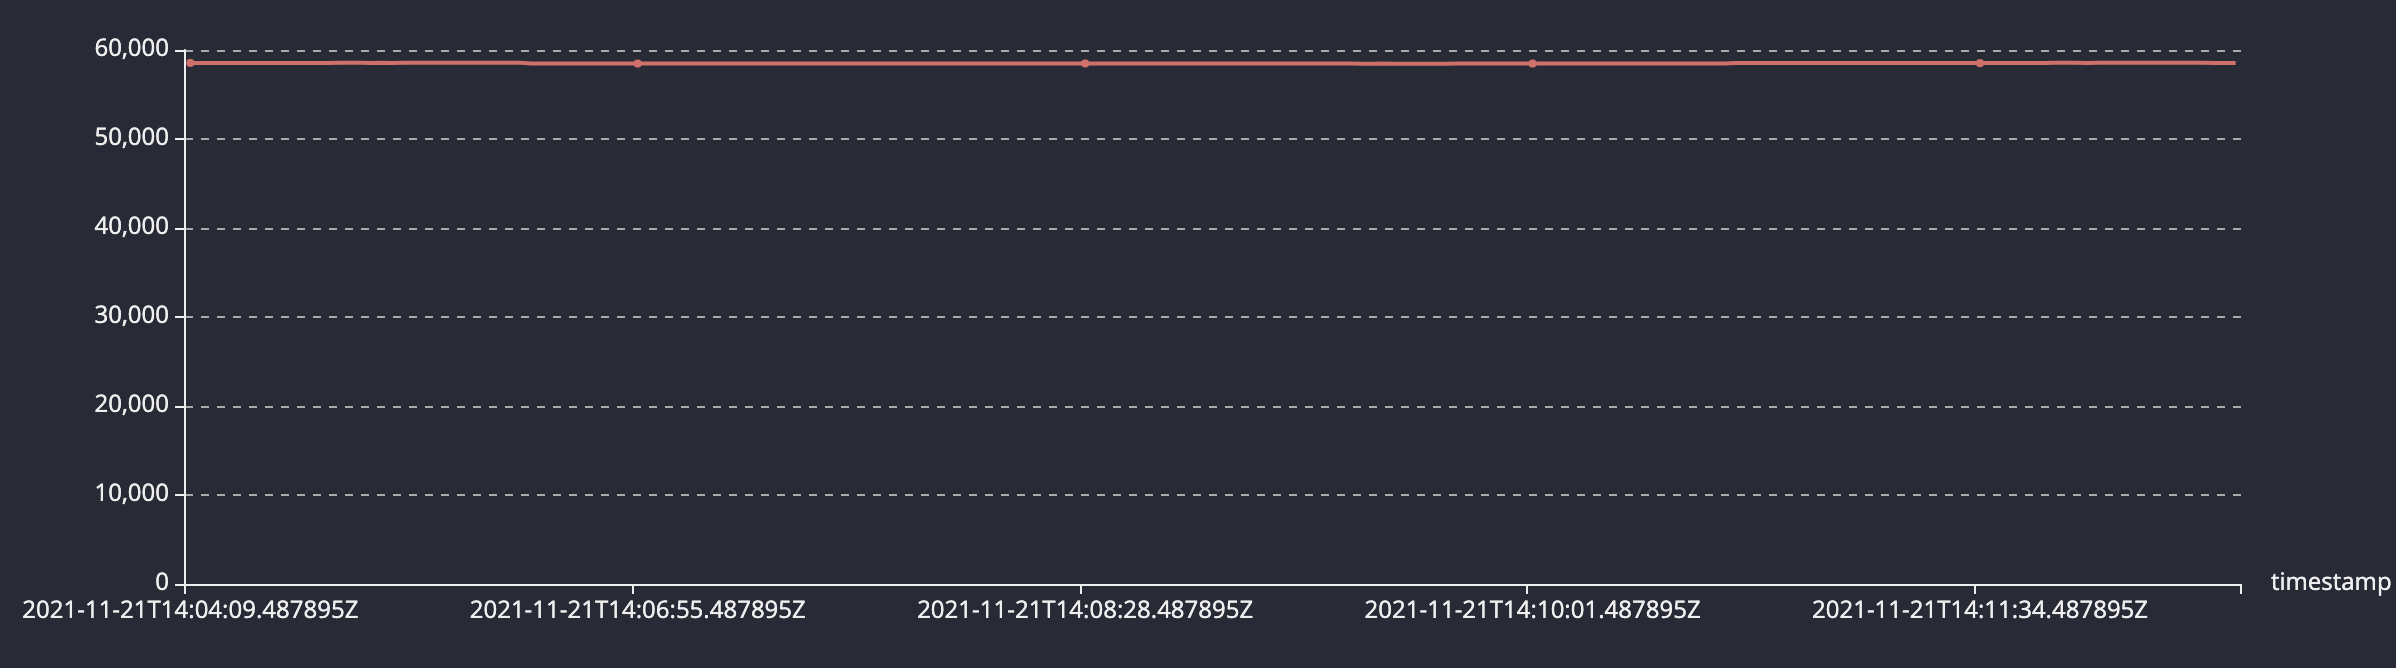
I like to use the chart tab in the console. However, the chart scale is not customisable and starts at 0. This makes it hard to visualise data where the changes are relatively small.
Describe the solution you'd like.
Either
- Dynamic scaling of the charts based on results values
- Manual scaling by adding a range min/max input in the console
Describe alternatives you've considered.
I tried to use scale factors in the query but this is not very practical.
Additional context.