BUG: contour plot levels #868
Conversation
e8643aa to
cb16fd9
Compare
xarray/plot/plot.py
Outdated
| if levels is None: | ||
| levels = 7 # this is the matplotlib default | ||
| # A colorbar with one level is not possible with mpl | ||
| try: |
There was a problem hiding this comment.
Can we do a type check instead? e.g.,
if (isinstance(levels, int) and levels < 2) or len(levels) < 2:
    add_colorbar = False
There was a problem hiding this comment.
We could also change the default to add_colorbar=None, and only apply this logic if add_colorbar wasn't set directly.
|
I wonder -- would it maybe make more sense to simply not to add a colorbar by default? It's pretty easy to toggle if desired. |
|
@shoyer yes, this was my original idea too: I think it's better now, let me know what you think. |
| if not filled: | ||
| # non-filled contour plots | ||
| extend = 'neither' | ||
| extend = 'max' |
There was a problem hiding this comment.
I think I missed the rationale for this one -- why should this change?
There was a problem hiding this comment.
This is the actual bug fix for #866 which motivated this PR ;-).
xarray wasn't plotting contours correctly before this change, see the following code:
import numpy as np
import matplotlib.pyplot as plt
import xarray as xr

x, y = np.meshgrid(np.arange(12), np.arange(12))
z = xr.DataArray(np.sqrt(x**2 + y**2))
z.plot.contour(levels=[2, 4, 6, 8], add_colorbar=False, colors='k')
plt.show()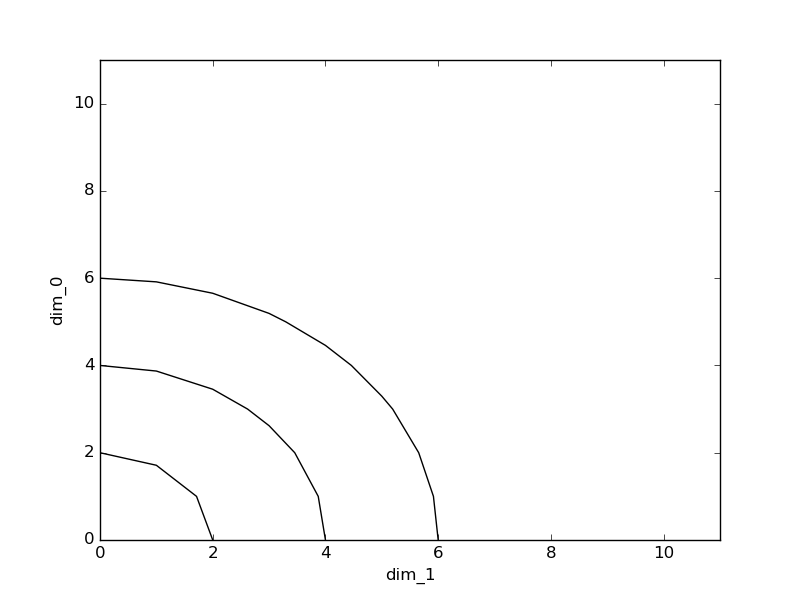
With this fix everything is fine now:

Intuitively, it also makes sense: the last contour does mark all data beyond the last level, hence extend = 'max'
This should fix #866