plt.pcolormesh will infer interval breaks per default #4364
Description
Looking at some warnings in #3266 I saw that matplotlib will deprecate the old behaviour of pcolormesh when the shape of the data and the coordinates are equal (they silently cut a row and a column of the data). With the new behaviour they will interpolate the coordinates.
import numpy as np
import matplotlib.pyplot as plt

x = np.array([1, 2, 3])
y = np.array([1, 2, 3, 4, 5])

data = np.random.randn(*y.shape + x.shape)

f, axes = plt.subplots(1, 2)

for ax, shading, behavior in zip(axes, ["flat", "nearest"], ["old", "new"]):
  ax.pcolormesh(x, y, data, shading=shading, vmin=-0.75, vmax=0.75)
  ax.set_title(f"{behavior}: shading='{shading}'")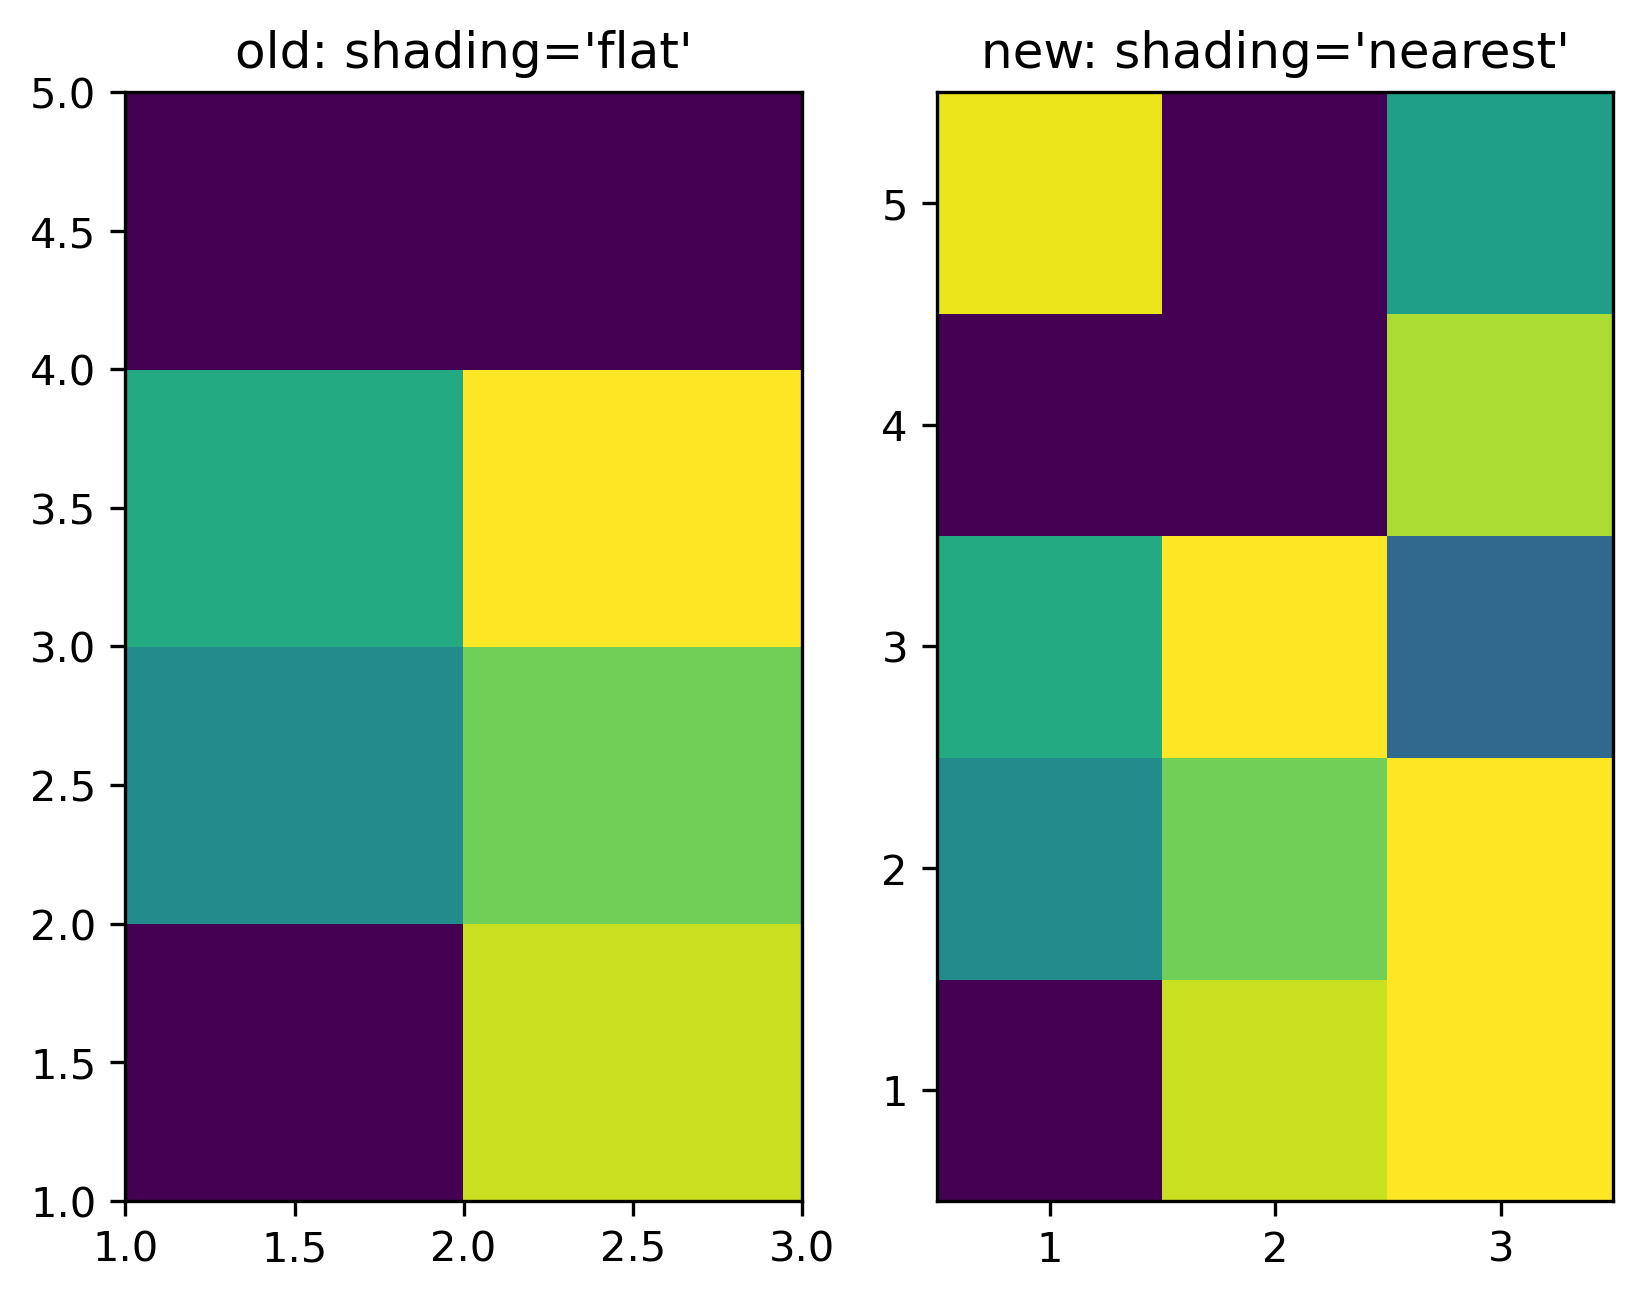
This is a good thing in general - we already do this for a long time with the infer_intervals keyword. Unfortunately they don't check if the data is monotonic (matplotlib/matplotlib#18317) which can lead to problems for maps (SciTools/cartopy#1638). I don't think there is a need to do something right now - let's see what they think upstream.
This change was introduced in mpl 3.3.0