[tsdb] re-implement WAL watcher to read via a "notification" channel#11949
[tsdb] re-implement WAL watcher to read via a "notification" channel#11949
Conversation
the TSDB code

Signed-off-by: Callum Styan <[email protected]>
| return nil | ||
|
|
||
| // we haven't read due to a notification in quite some time, try reading anyways | ||
| case <-readTicker.C: |
There was a problem hiding this comment.
You could do case <-readTicker.C, <-w.ReadNotify: here, but then you wouldn't get to log which event caused the read (if you want to keep that).
There was a problem hiding this comment.
I'd like to keep the logging, knowing there was a timeout can be useful. The log level can be debug imo.
There was a problem hiding this comment.
Not blocking, but it would be nice to consolidate the error checking and handling to a function that is reused between the two paths.
tsdb/wlog/watcher.go
Outdated
| return err | ||
| } | ||
|
|
||
| case <-w.readNotify: |
There was a problem hiding this comment.
I wonder what would happen if we receive several read notifications while we are already busy processing a read notification. In that case would we want to drain the readNotify channel before we begin reading? If that's done, then we would have satisfied all the read requests via just one read.
There was a problem hiding this comment.
Actually, since this is an unbufferend channel, I guess the Notfy() function would just block in such a situation?
There was a problem hiding this comment.
I used select with a default case to explicitly not block.
The theory is that throwing away a notification is not the end of the world. In prometheus' with high scrape load we're probably getting a lot of notifications we don't really need, since for each read by the WAL watcher it reads until EOF. If we were sending a notification "hey, read X bytes" we couldn't get away with throwing these notifications away. In the case of a prometheus with a low scrape load it's very unlikely that we're going to throw away a notification.
This reminds me that adding metrics to track dropping of notifications is a good idea.
tsdb/wlog/wlog.go
Outdated
| defer w.mtx.Unlock() | ||
| defer func() { | ||
| if w.WriteNotified != nil { | ||
| w.WriteNotified.Notify() |
There was a problem hiding this comment.
How much notify is too much notify? Alternatively, we can call this once at the end of logging in a TSDB commit (here) because a single commit (hence the scrape) can have more than one WAL logging (more common once native histograms get adopted).
There was a problem hiding this comment.
I'll move the call to Notify, good call.
There was a problem hiding this comment.
I'm not 100% sure if the only creation of the head struct for a normal prometheus (not read-only) is via the db open call? Is there a similar FlushWAL that could create another new head struct? If not I can clean up the saving of the reference to the interface even further than my most recent commit.
 codesome
left a comment
codesome
left a comment
There was a problem hiding this comment.
The added interface in TSDB looks fine. What was the load (#series, #samples/sec) that you tested this with? I am curious if at a high load too many notify calls would be a problem and if the backoff turns out to be better.
So far I've only tested this with two prometheus' deployed locally, both scraping each other. As you mentioned on slack we can test in our dev environments, but this also reminds me that it would be nice to include remote write in prombench. |
I'd also be happy to help test this in Grafana Agent, our deployments there have a modest throughput (~2000 remote_writes/s). |
on each WAL Log call

Signed-off-by: Callum Styan <[email protected]>
@rfratto yeah if we can deploy a second set of agents with these changes to compare the two that would be helpful, let me know how I can help |
Signed-off-by: Callum Styan <[email protected]>
Signed-off-by: Callum Styan <[email protected]>
Signed-off-by: Callum Styan <[email protected]>
Signed-off-by: Callum Styan <[email protected]>
Signed-off-by: Callum Styan <[email protected]>
aeea6c1 to
43059fc
Compare
 csmarchbanks
left a comment
csmarchbanks
left a comment
There was a problem hiding this comment.
A few small comments but generally this looks good to me.
storage/remote/current.txt
Outdated
There was a problem hiding this comment.
I don't think all of these benchmarks should be part of this PR, it looks like they are related to the new format/compression algorithms?
storage/remote/storage.go
Outdated
| } | ||
|
|
||
| func (s *Storage) Notify() { | ||
| for _, s := range s.rws.queues { |
There was a problem hiding this comment.
Nit: I don't love that we are shadowing s here, maybe q instead?
tsdb/wlog/watcher.go
Outdated
| case <-readTicker.C: | ||
| level.Debug(w.logger).Log("msg", "Watcher is reading the WAL due to timeout, haven't received any write notifications recently", "timeout", readTimeout) | ||
| err = w.readSegment(reader, segmentNum, tail) | ||
| readTicker.Reset(readTimeout) |
There was a problem hiding this comment.
Is it necessary to reset the ticker here? It would have just triggered so should be a full 15 seconds until the next trigger.
There was a problem hiding this comment.
IMO we still should reset, the read could take some amount of time. I don't think calling reset is expensive in some way either?
I'm not opposed to removing it either.
There was a problem hiding this comment.
🤷 leaving it in seems fine, it's an edge case anyway.
| return nil | ||
|
|
||
| // we haven't read due to a notification in quite some time, try reading anyways | ||
| case <-readTicker.C: |
There was a problem hiding this comment.
Not blocking, but it would be nice to consolidate the error checking and handling to a function that is reused between the two paths.
|
FWIW, I deployed this on a set of 8 Grafana Agents which (in total) write 450,000 samples/sec to their WALs. We aren't seeing any noticeable effect on CPU consumption after the deploy around ~17:20 UTC (the other annotation lines are unrelated deploys):
It doesn't decrease CPU usage either, but that's only expected to be observable with really low scrape loads. |

Signed-off-by: Callum Styan <[email protected]>
Signed-off-by: Callum Styan <[email protected]>
csmarchbanks
left a comment
There was a problem hiding this comment.
Looks like some CI failures now, but 👍 , thanks for making the helper function.
tsdb/wlog/watcher.go
Outdated
| case <-readTicker.C: | ||
| level.Debug(w.logger).Log("msg", "Watcher is reading the WAL due to timeout, haven't received any write notifications recently", "timeout", readTimeout) | ||
| err = w.readSegment(reader, segmentNum, tail) | ||
| readTicker.Reset(readTimeout) |
There was a problem hiding this comment.
🤷 leaving it in seems fine, it's an edge case anyway.
Signed-off-by: Callum Styan <[email protected]>
Signed-off-by: Callum Styan <[email protected]>
read ticker timeout instead of calling the Notify function

Signed-off-by: Callum Styan <[email protected]>
Signed-off-by: Callum Styan <[email protected]>
**What this PR does / why we need it**:

This PR implements a new mechanism for the wal Watcher in Promtail, to
know there are new records to be read. It uses a combination of:
- prometheus/prometheus#11950
- prometheus/prometheus#11949

The main idea is that the primary mechanism is a notification channel
between the `wal.Writer` and `wal.Watcher`. The Watcher subscribes to
write events the writer publishes, getting notified if the wal has been
written. The same subscriptions design is used for cleanup events.

As a backup, the watcher has a timer that implements an exponential
backoff strategy, which is constrained by a minimum and maximum that the
user can configure.

Below the cpu difference is shown of running both main and this branch
against the same scrape target.

<img width="2496" alt="image"
src="https://user-images.githubusercontent.com/2617411/232099483-7e5c36fa-9360-4eb9-8240-687adf46e330.png">

The yellow line is the latest main build from where this branch started,
and the green line is this branch. Both promtails tailing docker logs,
and using the following metrics to get cpu usage from cadvisor:
```
avg by (name) (rate(container_cpu_usage_seconds_total{job=~".+", instance=~".+", name=~"promtail-wal-test_promtail.+"}[$__rate_interval]))
```

**Which issue(s) this PR fixes**:
Part of #8197

**Special notes for your reviewer**:

**Checklist**
- [ ] Reviewed the
[`CONTRIBUTING.md`](https://github.com/grafana/loki/blob/main/CONTRIBUTING.md)
guide (**required**)
- [ ] Documentation added
- [ ] Tests updated
- [ ] `CHANGELOG.md` updated
- [ ] Changes that require user attention or interaction to upgrade are
documented in `docs/sources/upgrading/_index.md`
prometheus ruler added a feature of notifying the reader when a sample is appended instead of waiting loop burning the CPU cycles.
prometheus/prometheus#11949

Also should fix: #10859

Signed-off-by: Kaviraj <[email protected]>
**What this PR does / why we need it**:
prometheus ruler added a feature of notifying the reader when a sample
is appended, instead of waiting in a loop burning the CPU cycles.
prometheus/prometheus#11949

This changes a default behaviour a bit. Now if `notify` is not enabled,
next read is done only when next readTicker is triggered.

**Which issue(s) this PR fixes**:
Also should fix #10859

**Special notes for your reviewer**:
Adding few more details for the sake of completeness.

We found this via more frequent failures of rule-evaluation integration
tests linked on the issue above. After some investigation, we tracked
down to prometheus changes.

Prometheus introduced new type `wlog.WriteNotified` interface with
`Notify()` method with a goal to notify any waiting readers, that some
write is done.

Two types implements this type `wlog.Watcher` and `remote.Storage`.
`remote.Storage` implements `Notify()` by just calling it's queues
`wlog.Watcher`'s `Notify()` under the hood.

How are these types impacts Loki ruler?

Loki ruler also uses `remote.Storage`. So when any samples got committed
via `appender`, we have to notify the remote storage.

**Checklist**
- [ ] Reviewed the
[`CONTRIBUTING.md`](https://github.com/grafana/loki/blob/main/CONTRIBUTING.md)
guide (**required**)
- [ ] Documentation added
- [ ] Tests updated
- [ ] `CHANGELOG.md` updated
- [ ] If the change is worth mentioning in the release notes, add
`add-to-release-notes` label
- [ ] Changes that require user attention or interaction to upgrade are
documented in `docs/sources/setup/upgrade/_index.md`
- [ ] For Helm chart changes bump the Helm chart version in
`production/helm/loki/Chart.yaml` and update
`production/helm/loki/CHANGELOG.md` and
`production/helm/loki/README.md`. [Example
PR](d10549e)

---------

Signed-off-by: Kaviraj <[email protected]>
**What this PR does / why we need it**:
prometheus ruler added a feature of notifying the reader when a sample
is appended, instead of waiting in a loop burning the CPU cycles.
prometheus/prometheus#11949

This changes a default behaviour a bit. Now if `notify` is not enabled,
next read is done only when next readTicker is triggered.

**Which issue(s) this PR fixes**:
Also should fix grafana#10859

**Special notes for your reviewer**:
Adding few more details for the sake of completeness.

We found this via more frequent failures of rule-evaluation integration
tests linked on the issue above. After some investigation, we tracked
down to prometheus changes.

Prometheus introduced new type `wlog.WriteNotified` interface with
`Notify()` method with a goal to notify any waiting readers, that some
write is done.

Two types implements this type `wlog.Watcher` and `remote.Storage`.
`remote.Storage` implements `Notify()` by just calling it's queues
`wlog.Watcher`'s `Notify()` under the hood.

How are these types impacts Loki ruler?

Loki ruler also uses `remote.Storage`. So when any samples got committed
via `appender`, we have to notify the remote storage.

**Checklist**
- [ ] Reviewed the
[`CONTRIBUTING.md`](https://github.com/grafana/loki/blob/main/CONTRIBUTING.md)
guide (**required**)
- [ ] Documentation added
- [ ] Tests updated
- [ ] `CHANGELOG.md` updated
- [ ] If the change is worth mentioning in the release notes, add
`add-to-release-notes` label
- [ ] Changes that require user attention or interaction to upgrade are
documented in `docs/sources/setup/upgrade/_index.md`
- [ ] For Helm chart changes bump the Helm chart version in
`production/helm/loki/Chart.yaml` and update
`production/helm/loki/CHANGELOG.md` and
`production/helm/loki/README.md`. [Example
PR](grafana@d10549e)

---------

Signed-off-by: Kaviraj <[email protected]>
EDIT: this is technicaly an implementation change, but could probably still use a changelog entry
[ENHANCEMENT] reimplemented WAL watcher reading code in a way that should reduce overall CPU usage in low scrape throughput deploymentsThis PR modifiers the WAL watcher to not poll on a timer for reading the WAL, but rather only read when it recieves a notification over a channel from the TSDB code.
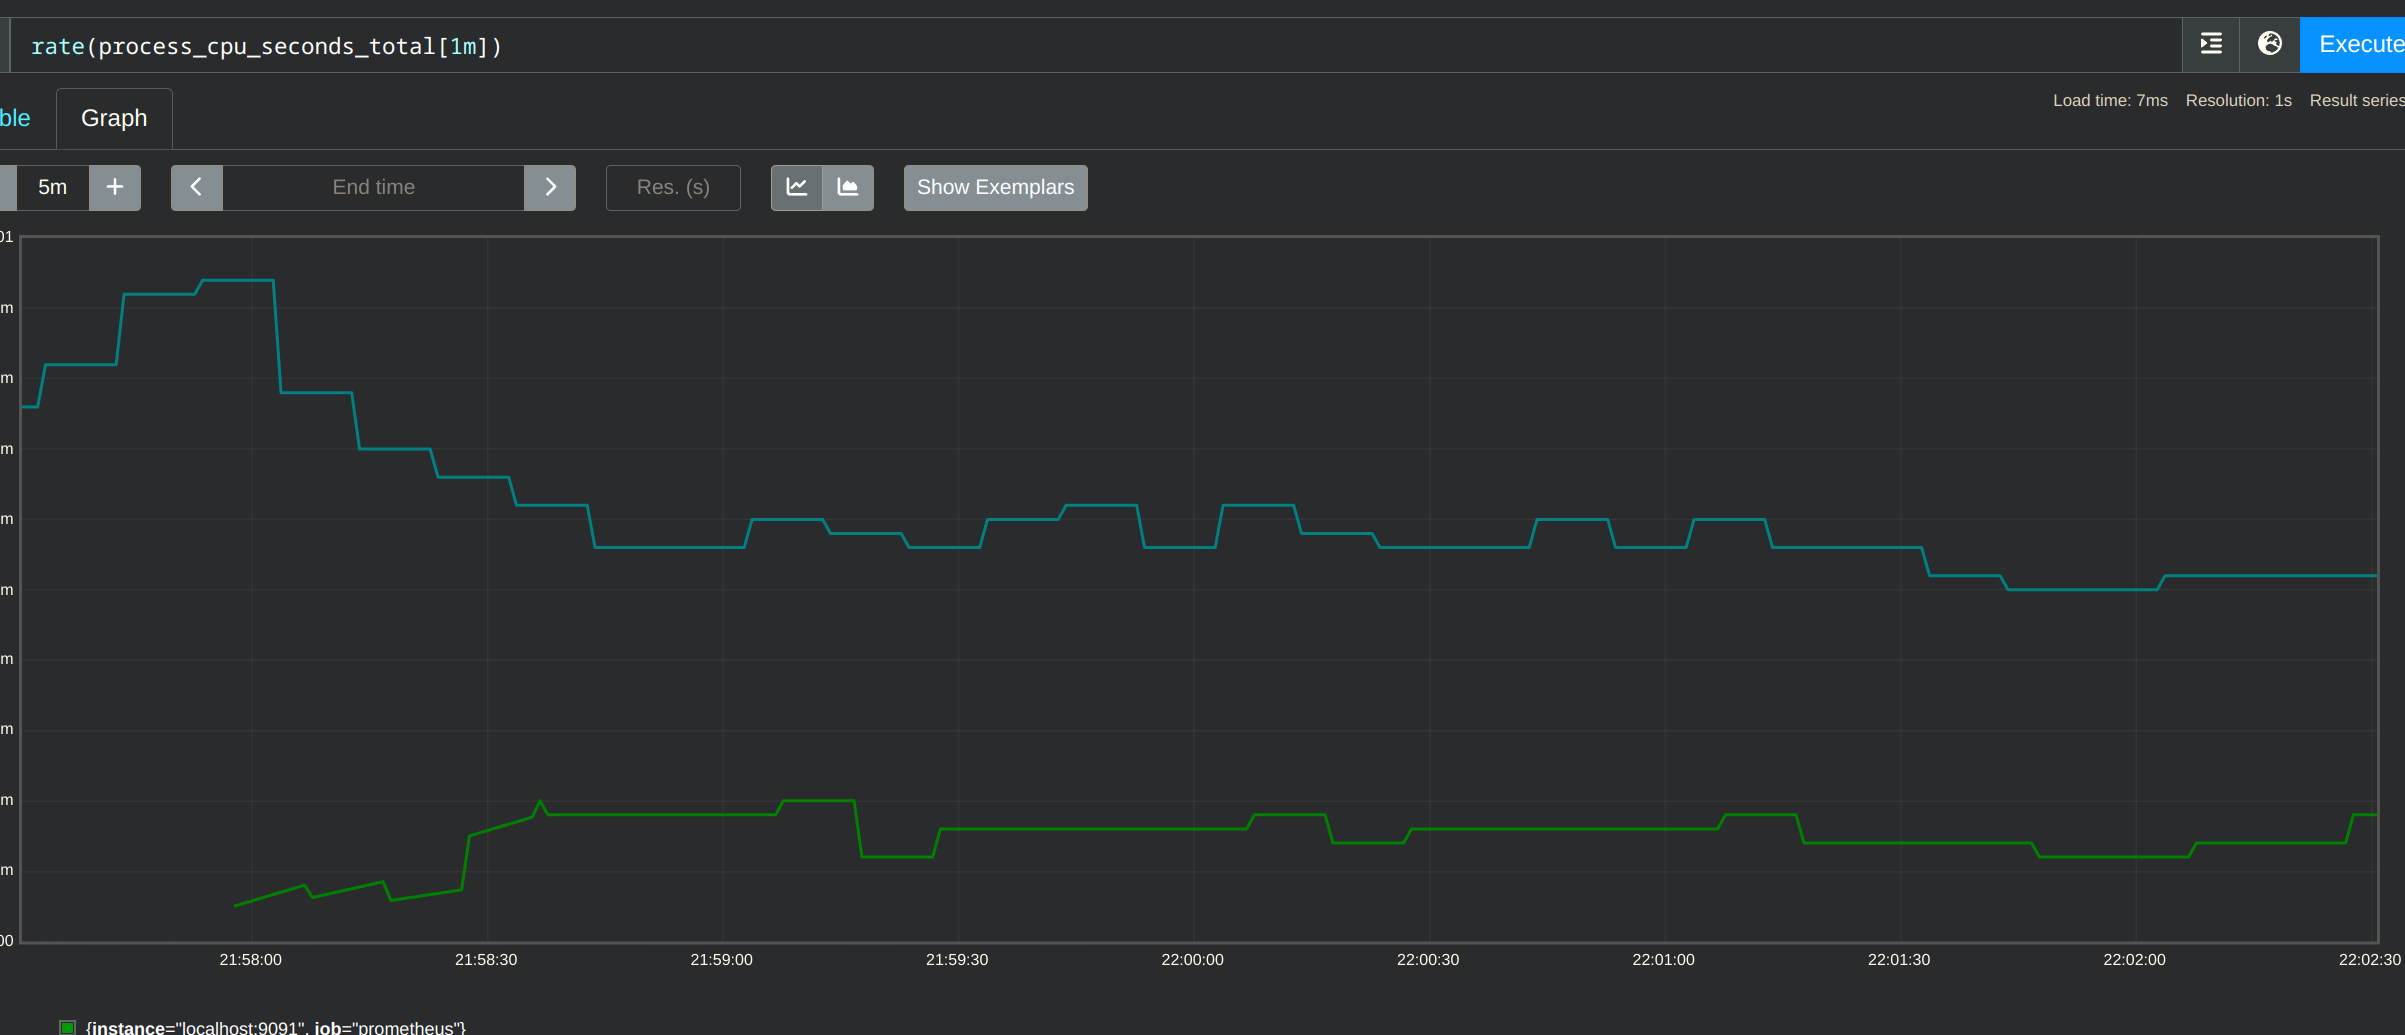
This shows CPU usage where the green line is the prometheus instance running with this PR's changes, and the teal line is the a build from the current main branch. I think in github the image is slightly cut-off, the decrease is between 60 and 70%.
Signed-off-by: Callum Styan [email protected]