Update 2024
FYI
Recently added some tools in the Metrics window.
(1)
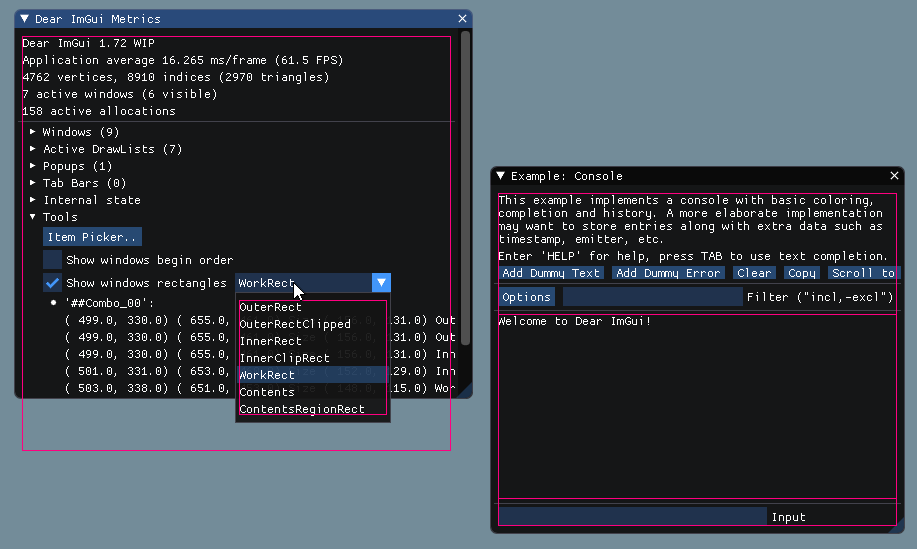
The "Item Picker" will allow you to pick an item and have dear imgui break within the call-stack of that item. This is useful if you have large UI / codebase and you would to easily find out where some UI item is emitted. This only works on item that are hoverable and have an identifier, so e.g. raw ImGui::Text() items won't work.


This will call IM_DEBUG_BREAK() which for Clang and Visual Studio default to a nice debugger break, for other compiles default to an unsatisfying IM_ASSERT(0) (can improve!). You can always #define IM_DEBUG_BREAK to anything in imconfig.h. See commit: 130b449
(2)
The "Show windows rectangles" tool allows you to visualize various rectangles which purpose may otherwise be difficult to understand. If you need to work within dear imgui codebase this can be useful to clarify what's going on.
Update 2024
io.ConfigDebugIsDebuggerPresentis not set. This is partly to promote the discovery of both the item picker and theio.ConfigDebugIsDebuggerPresentoption.Metrics->Tools.FYI
Recently added some tools in the Metrics window.
(1)
The "Item Picker" will allow you to pick an item and have dear imgui break within the call-stack of that item. This is useful if you have large UI / codebase and you would to easily find out where some UI item is emitted. This only works on item that are hoverable and have an identifier, so e.g. raw
ImGui::Text()items won't work.This will call
IM_DEBUG_BREAK()which for Clang and Visual Studio default to a nice debugger break, for other compiles default to an unsatisfyingIM_ASSERT(0)(can improve!). You can always#define IM_DEBUG_BREAKto anything in imconfig.h. See commit: 130b449(2)

The "Show windows rectangles" tool allows you to visualize various rectangles which purpose may otherwise be difficult to understand. If you need to work within dear imgui codebase this can be useful to clarify what's going on.