Repository navigation
The face color of a patch affects its hatches in PDF viewed with Acrobat Reader #9894
Description

Bug summary
Originally reported in the thread of #8431.
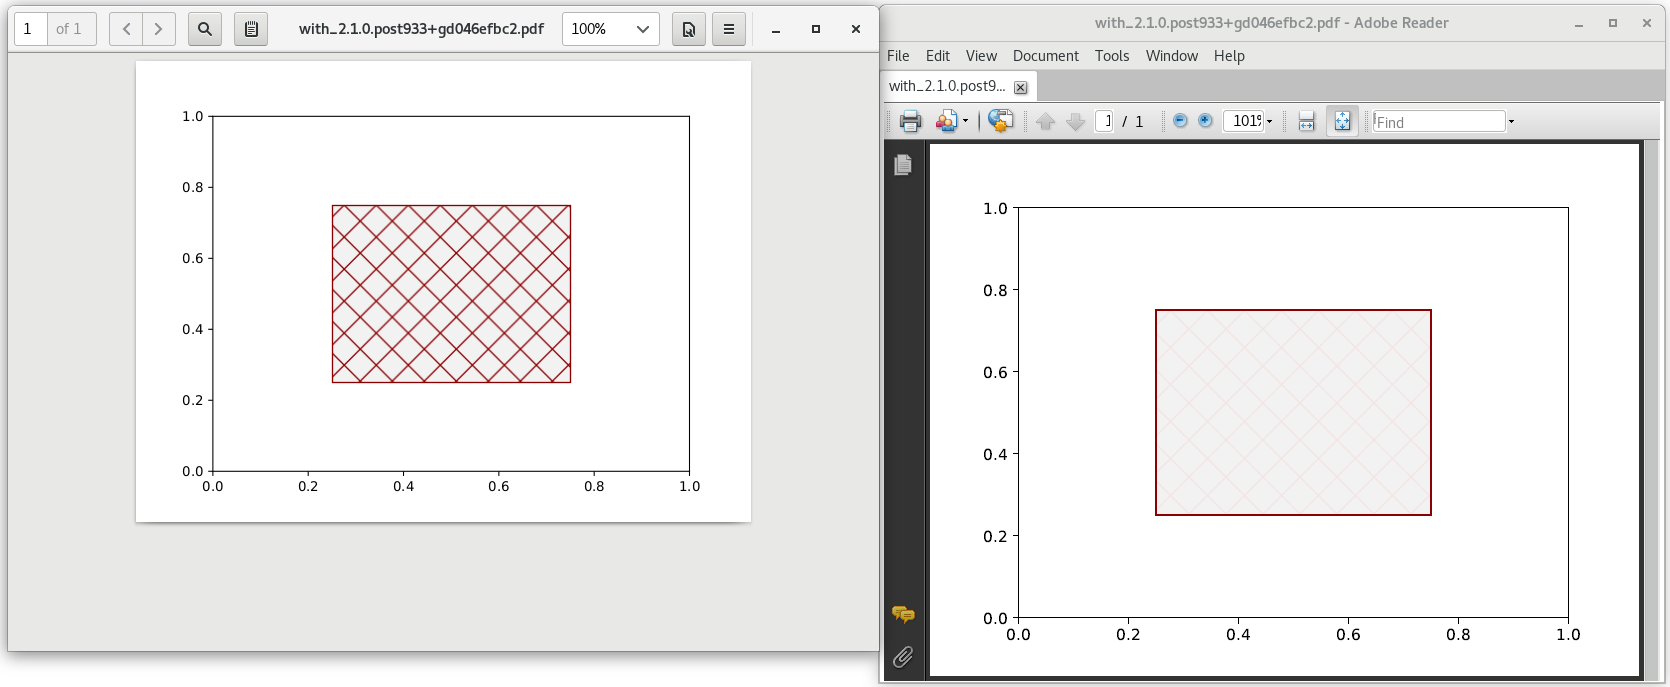
When using hatches with a patch and exporting to a PDF, the patch face color seems to also be applied to (or to overlay) the hatches when viewing the file with Acrobat Reader, which is neither the case in the Matplotlib interactive window nor when opening the same PDF with Evince. Not sure if it is the alpha value of the face color that is wrongly interpreted, or simply the z-order between the face color and the hatches.
Code for reproduction
import matplotlib.pyplot as plt
import matplotlib.patches as mpatches
import matplotlib as mpl

rect = mpatches.Rectangle((0.25, 0.25), 0.5, 0.5, hatch="x",
                          edgecolor="darkred", facecolor=[0.5, 0.5, 0.5, 0.1])

fig, ax = plt.subplots()
ax.add_patch(rect)
fig.savefig("with_{0}.pdf".format(mpl.__version__))
Actual outcome
An exemple of the PDF produced by the snippet above:
with_2.1.0.post933+gd046efbc2.pdf
A screenshot comparing this file opened with Evince (on the left) and with Acrobat Reader (on the right):
I get a similar output/behavior with Matplotlib 2.0.0. However, with Matplotlib 1.5.3, something is going wrong and I am thrown the following traceback below, so I do not know if it is really a kind of regression.
# Traceback when tryin to run the MWE with tags/v1.5.3

---------------------------------------------------------------------------
ImportError                               Traceback (most recent call last)
~/Playground/Matplotlib/transparent_hatches/mwe_issue.py in <module>()
     10 fig, ax = plt.subplots()
     11 ax.add_patch(rect)
---> 12 fig.savefig("with_{0}.pdf".format(mpl.__version__))

~/FOSS/matplotlib/lib/matplotlib/figure.py in savefig(self, *args, **kwargs)
   1561             self.set_frameon(frameon)
   1562
-> 1563         self.canvas.print_figure(*args, **kwargs)
   1564
   1565         if frameon:

~/FOSS/matplotlib/lib/matplotlib/backends/backend_qt5agg.py in print_figure(self, *args, **kwargs)
    201
    202     def print_figure(self, *args, **kwargs):
--> 203         FigureCanvasAgg.print_figure(self, *args, **kwargs)
    204         self.draw()
    205

~/FOSS/matplotlib/lib/matplotlib/backend_bases.py in print_figure(self, filename, dpi, facecolor, edgecolor, orientation, format, **kwargs)
   2137
   2138         # get canvas object and print method for format
-> 2139         canvas = self._get_output_canvas(format)
   2140         print_method = getattr(canvas, 'print_%s' % format)
   2141

~/FOSS/matplotlib/lib/matplotlib/backend_bases.py in _get_output_canvas(self, format)
   2069
   2070         # check if there is a default canvas for the requested format
-> 2071         canvas_class = get_registered_canvas_class(format)
   2072         if canvas_class:
   2073             return self.switch_backends(canvas_class)

~/FOSS/matplotlib/lib/matplotlib/backend_bases.py in get_registered_canvas_class(format)
    135     backend_class = _default_backends[format]
    136     if cbook.is_string_like(backend_class):
--> 137         backend_class = import_module(backend_class).FigureCanvas
    138         _default_backends[format] = backend_class
    139     return backend_class

~/anaconda3/envs/matplotlib_dev/lib/python3.6/importlib/__init__.py in import_module(name, package)
    124                 break
    125             level += 1
--> 126     return _bootstrap._gcd_import(name[level:], package, level)
    127
    128

~/anaconda3/envs/matplotlib_dev/lib/python3.6/importlib/_bootstrap.py in _gcd_import(name, package, level)

~/anaconda3/envs/matplotlib_dev/lib/python3.6/importlib/_bootstrap.py in _find_and_load(name, import_)

~/anaconda3/envs/matplotlib_dev/lib/python3.6/importlib/_bootstrap.py in _find_and_load_unlocked(name, import_)

~/anaconda3/envs/matplotlib_dev/lib/python3.6/importlib/_bootstrap.py in _load_unlocked(spec)

~/anaconda3/envs/matplotlib_dev/lib/python3.6/importlib/_bootstrap_external.py in exec_module(self, module)

~/anaconda3/envs/matplotlib_dev/lib/python3.6/importlib/_bootstrap.py in _call_with_frames_removed(f, *args, **kwds)

~/FOSS/matplotlib/lib/matplotlib/backends/backend_pdf.py in <module>()
     32 from matplotlib.backend_bases import RendererBase, GraphicsContextBase,\
     33     FigureManagerBase, FigureCanvasBase
---> 34 from matplotlib.backends.backend_mixed import MixedModeRenderer
     35 from matplotlib.cbook import Bunch, is_string_like, \
     36     get_realpath_and_stat, is_writable_file_like, maxdict

~/FOSS/matplotlib/lib/matplotlib/backends/backend_mixed.py in <module>()
      4 from matplotlib.externals import six
      5
----> 6 from matplotlib._image import frombuffer
      7 from matplotlib.backends.backend_agg import RendererAgg
      8 from matplotlib.tight_bbox import process_figure_for_rasterizing

ImportError: cannot import name 'frombuffer'
Expected outcome
The same behavior with both PDF viewers, i.e. the hatches not being affected by the the face color of the patch.
Matplotlib version
- Operating system: Linux (Fedora 27)
- Matplotlib version: 1.5.3, 2.0.0 and master
- Matplotlib backend (
print(matplotlib.get_backend())): - Python version: 3.6, from conda
- Jupyter version (if applicable):
- Other softwares: Acrobat Reader 9.5.5
Activity
anntzer commentedon Dec 1, 2017
mschauer commentedon Dec 1, 2017
I have an additional example where the hatch completely gets lost or rather covered by a non-transparent layer (so possibly the same problem as here).
afvincent commentedon Dec 1, 2017
@mschauer Did you mean
... edgecolor=[0.5, 0.5, 0.5, 0.1], facecolor=[0.5, 0.5, 0.5]...rather than... edgecolor=[0.5, 0.5, 0.5], facecolor=[0.5, 0.5, 0.5, 0.1]...? And indeed, it looks like if the facecolor of the patch was drawn above the hatches.mschauer commentedon Dec 1, 2017
No, it does not work for me as written above (note the difference is between
savefig(not working) andshow(working)).afvincent commentedon Dec 1, 2017
@mschauer Oh Gosh I'm tired: you're right... Sorry for the noise!
mschauer commentedon Dec 1, 2017
Thanks for picking that up with such a nice bug report, by the way.
QuLogic commentedon Dec 12, 2017
@afvincent you need to rebuild all the C extensions when you switch to such an old version.
JoElfner commentedon Feb 8, 2019
Is there any new on this? I just ran into this and thought it might be a quite important feature when making publication quality figures.
timhoffm commentedon Feb 14, 2019
If there was a PR it would probably be linked.
JoElfner commentedon Feb 15, 2019
Probably, yeah probably. This is the most typical kind of answer, that does not help.
Just saying: "No, there is no PR. It would be linked if there was one." Would make me reply: " Oh thanks. Yeah, didn't consider that."
But now I'm just like: "What the hell? Did I trip over your dog's tail?"
In fact I just wanted to know if there are any plans on making a PR for this issue. As pointed out, hatches are quite commonly used, since especially the top-tier scientific journal always require figures to be printable as grayscale AND in color. I know about the luminance of colormaps etc., but again especially in top-tier journals, (vivid) colors should be kept at a minimum and a clear distinction of patches is required. In fact, authors are encouraged to use hatches and different linestyles as primary patch/line distinction and colors as secondary distinction. My post was supposed to put emphasis on this.
anntzer commentedon Feb 15, 2019
As noted earlier in the thread, one solution is to use the https://github.com/anntzer/mplcairo renderer which does not suffer from this issue.
If an issue is not fixed more than a year after it was opened, it is often because we simply lack either the expertise, or the bandwidth to fix it (in this specific case, I fear that few of the current devs, if any, are familiar with the internals of the pdf backend). If it is that important for you, we would of course consider any suggested patch.
github-actions commentedon Apr 26, 2023
This issue has been marked "inactive" because it has been 365 days since the last comment. If this issue is still present in recent Matplotlib releases, or the feature request is still wanted, please leave a comment and this label will be removed. If there are no updates in another 30 days, this issue will be automatically closed, but you are free to re-open or create a new issue if needed. We value issue reports, and this procedure is meant to help us resurface and prioritize issues that have not been addressed yet, not make them disappear. Thanks for your help!
anntzer commentedon Apr 26, 2023
I haven't actually checked, but this seems likely to still be valid.
github-actions commentedon Jun 14, 2024
This issue has been marked "inactive" because it has been 365 days since the last comment. If this issue is still present in recent Matplotlib releases, or the feature request is still wanted, please leave a comment and this label will be removed. If there are no updates in another 30 days, this issue will be automatically closed, but you are free to re-open or create a new issue if needed. We value issue reports, and this procedure is meant to help us resurface and prioritize issues that have not been addressed yet, not make them disappear. Thanks for your help!