Repository navigation
Superscripts in axis label cut when saving .eps with bbox_inches="tight" #7075
Description

I have been saving some .eps plots using:
matplotlib.pyplot.savefig(file.eps, bbox_inches="tight")
and this works as expected; however, when using:
matplotlib.rcParams['text.usetex'] = True
matplotlib.pyplot.savefig(file.eps, bbox_inches="tight")
the y axis label is cut.
It has been noted before that there has been some issues with .eps fies and usetex (Bounding box no longer works for EPS files if usetex=True #85) but I don't know in what way the bounding box was wrong and I am also using a matplotlib version that is 5 years on.
Here is a somewhat forced example and the results.
Example
import numpy
from matplotlib import pyplot
from matplotlib import gridspec
from matplotlib.collections import LineCollection

def plotLines(file_name):

    # -- Misc ----------------------------------------------------------------
    axis_font_size = 50.
    line_thickness = 3.

    # -- Data ----------------------------------------------------------------
    angles = numpy.linspace(-180., 180, num=201)
    amp_values = [1., 2., 3.]

    line_values = []
    for amp in reversed(amp_values):
        sine = amp * (numpy.sin(angles * (numpy.pi/180.)))**-1
        line_values.append(zip(angles, sine))

    amp_values = numpy.array(amp_values)
    lines = LineCollection(
        line_values,
        array=amp_values,
        cmap=pyplot.cm.viridis,
        linewidth=line_thickness
        )

    # -- Init Plot -----------------------------------------------------------
    pyplot.clf()  # Clear plot area
    fig = pyplot.figure()
    ax_grid = gridspec.GridSpec(
        1, 2, wspace=0.05, hspace=0.00,
        width_ratios=[20, 1]
        )

    # -- Plot ----------------------------------------------------------------
    plot = pyplot.subplot(ax_grid[0])

    plot.add_collection(lines)

    # Axis limits
    plot.set_xlim([numpy.min(angles), numpy.max(angles)])
    plot.set_ylim([-numpy.max(amp_values), numpy.max(amp_values)])

    # Axis labels
    plot.set_xlabel(
        "$\\mathrm{Angle} \\, \\left[^{\\circ}\\right]$",
        fontsize=axis_font_size
        )
    plot.set_ylabel(
        "$\\mathrm{Amp} \\,"
        "\\times \\, \\left[\\mathrm{sine} \\,"
        "\\left(\\mathrm{Angle}\\right)\\right]^{-1}$",
        fontsize=axis_font_size,
        )

    # -- Colour Bar ----------------------------------------------------------
    cbar_axis = pyplot.subplot(ax_grid[1])

    cbar = pyplot.colorbar(lines, ticks=amp_values, cax=cbar_axis)

    # CBar Label
    cbar.ax.set_ylabel(
        "$\\mathrm{Amp}$",
        fontsize=axis_font_size,
        )

    # -- Save ----------------------------------------------------------------
    pyplot.savefig(
        "{:s}.eps".format(file_name),
        bbox_inches="tight",
        dpi=600
        )
    pyplot.close()


if __name__ == "__main__":
    plotLines("Without")
    import matplotlib as mpl
    mpl.rcParams['text.usetex'] = True  # Process all text with TeX
    plotLines("With")
Results
Without
As expected

With
Y axis label cut
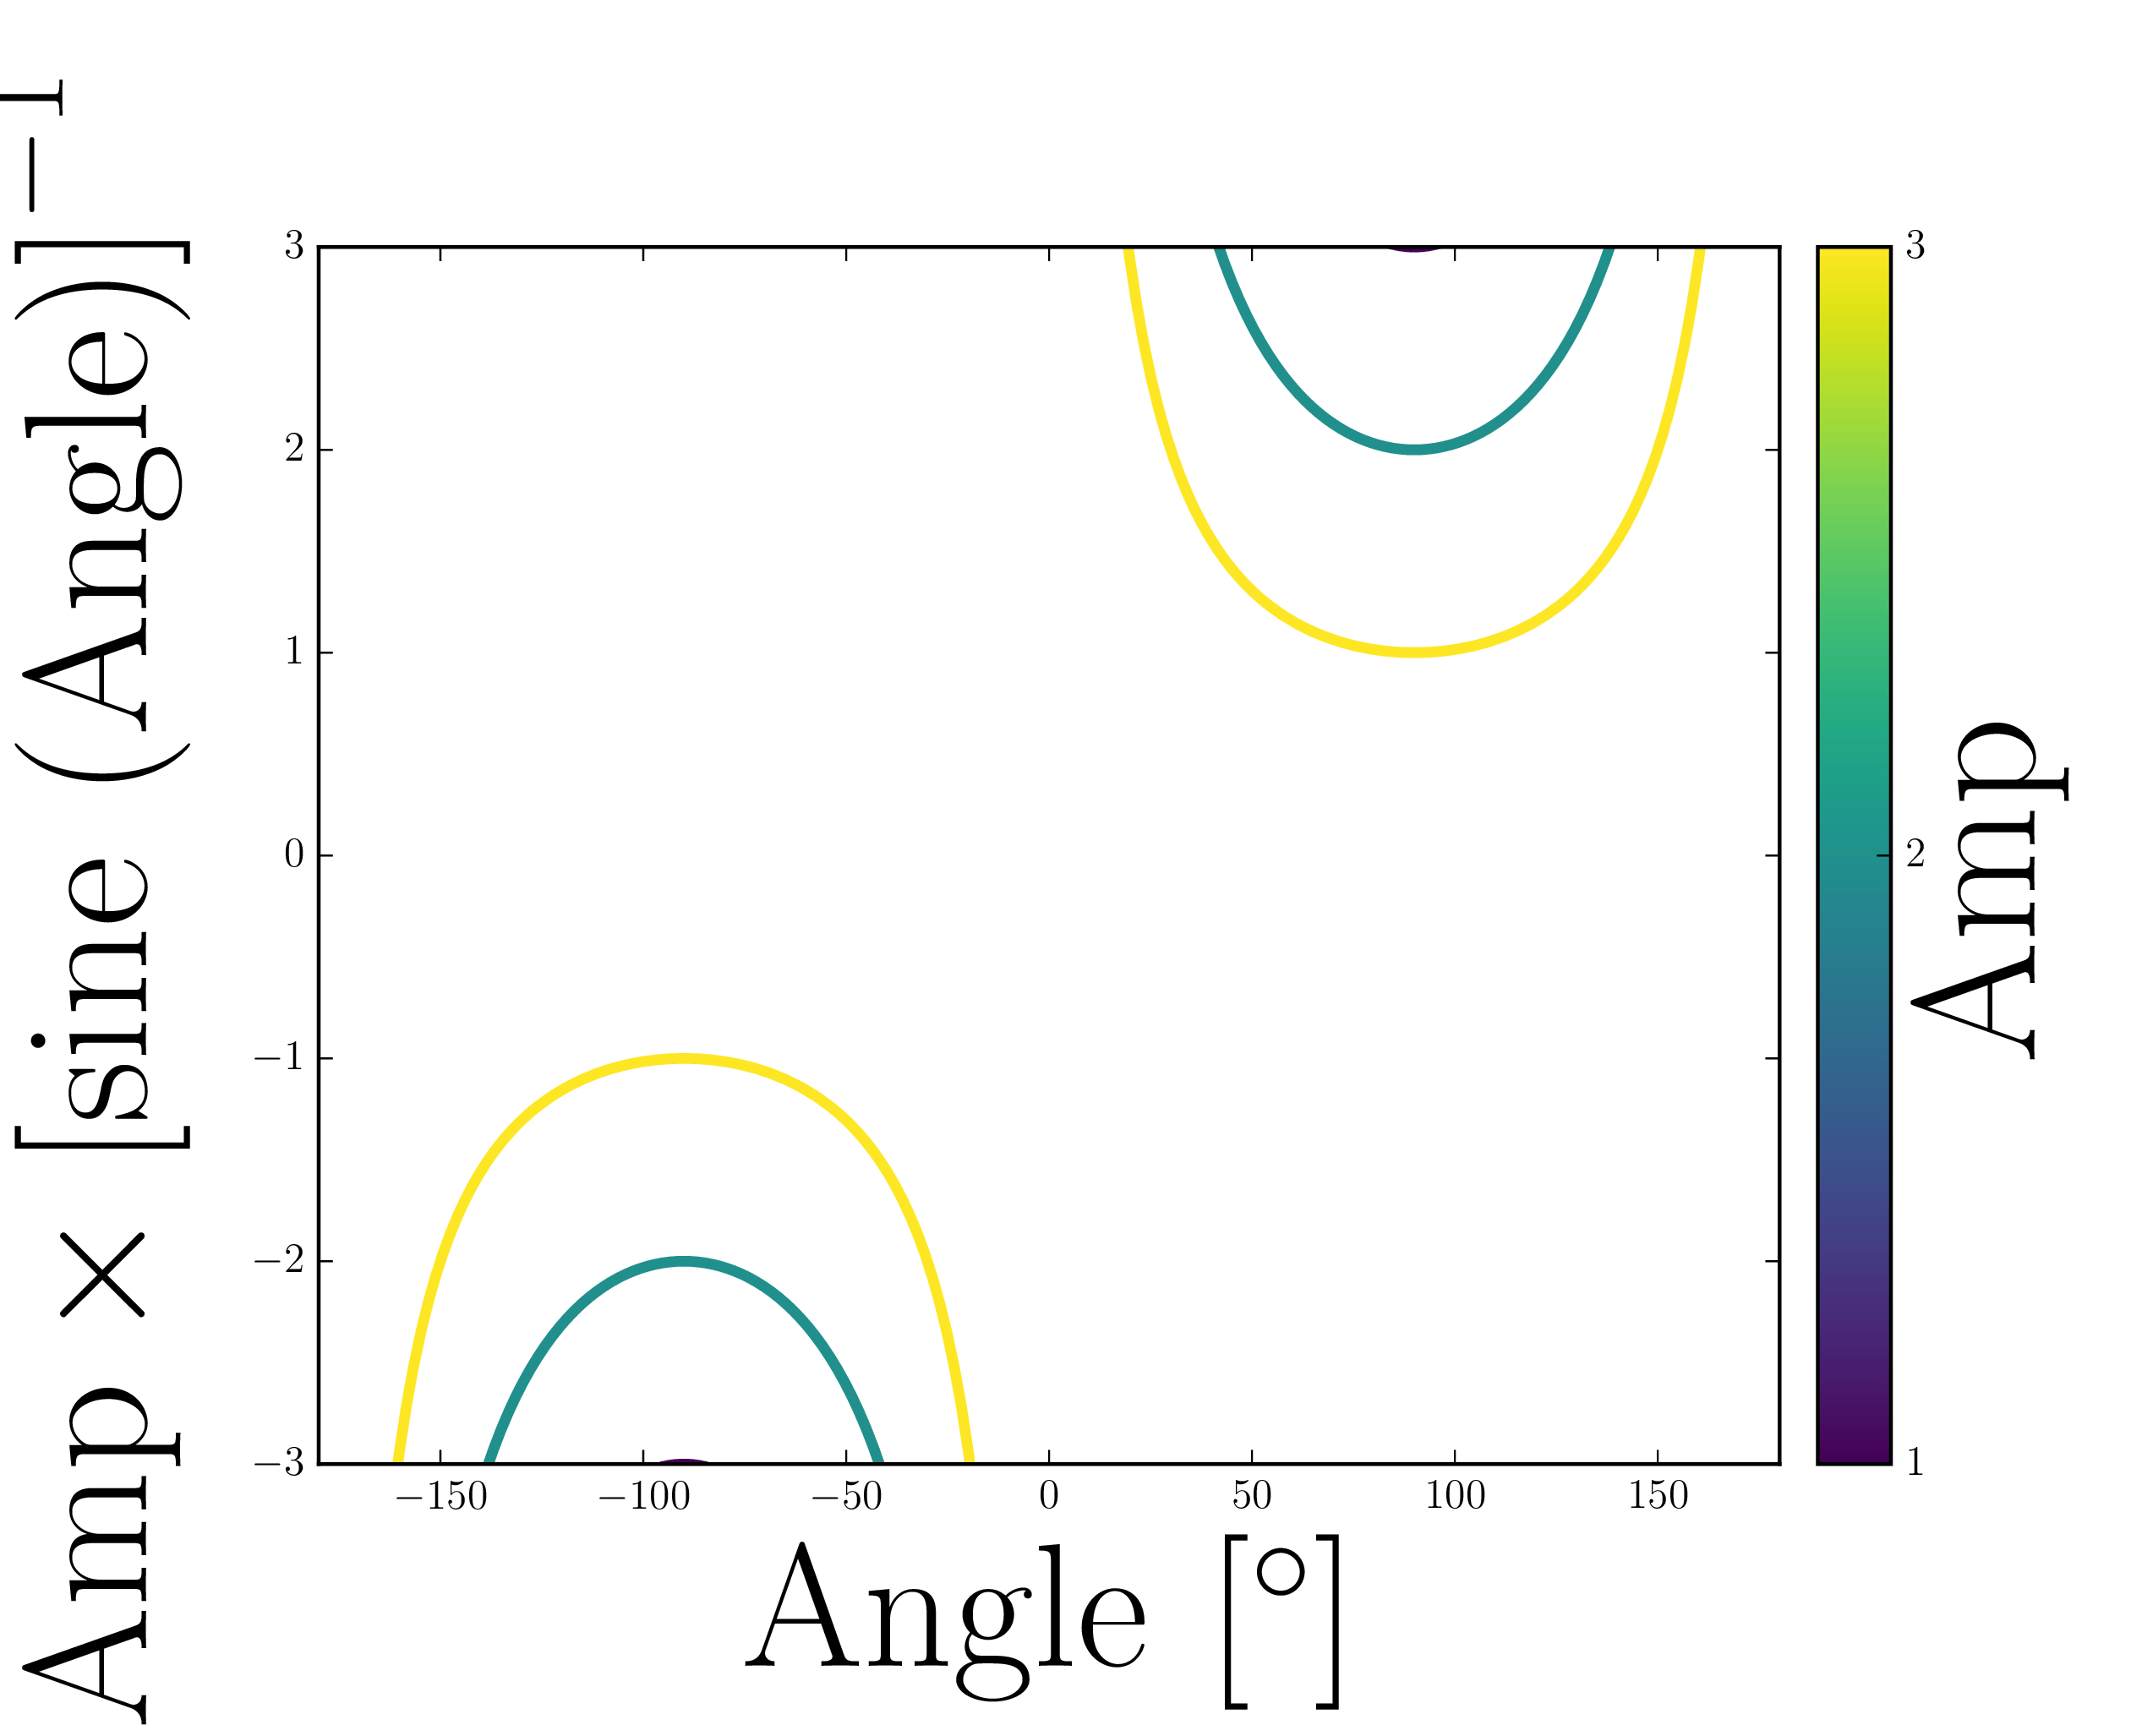
System
Matplotlib 1.5.1
Python 2.7.12 (Anaconda install)
CentOS Linux release 7.2.1511
GPL Ghostscript 9.07 (2013-02-14)
Activity
tohojo commentedon Feb 1, 2017
I've been having some issues with text bounding boxes being wrong for axis labels on 2.0 (when saving PDFs in my case). Will investigate if this is the same bug...
tohojo commentedon Feb 21, 2017
And to follow up on this, my issue is unrelated to usetex, so I don't think it's the same issue...
Warbo commentedon Jul 11, 2018
I was having trouble with y-axis labels being cut off: it was fine for pgf output, but broke when using EPS. Googling brought me here, so I tried removing 'usetex = True' and it solved the problem.
Don't render chart text with TeX
pyZerrenner commentedon Apr 30, 2019
For me this bug is DPI dependent. With the default DPI of 100 the following code gives a good result:
However, when I increase the DPI, the superscript of the y-label is cut off. With
plt.rcParams['figure.dpi'] = 300the result is:The same happens for saving as pdf or when setting
'savefig.dpi'instead of'figure.dpi'. My current solution is to increase the value ofpad_inchesuntil everything is visible. This increases the padding on all sides, which is not too bad, but still annoying.When using TeX for text rendering, the issue appears for all DPI, like in the comments above. With
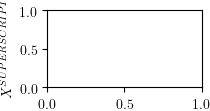
plt.rcParams['figure.dpi'] = 100andplt.rcParams['text.usetex'] = TrueI get:Maybe the DPI and TeX issues are somewhat unrelated, but I didn't want to open a new issue unnecessarily.
I am using matplotlib 2.2.4 on Python 3.6 myself. Unfortunately, I cannot verify this with the latest version (matplotlib 3.0.3) right now, so I hope this has not been resolved yet. (Or rather I do hope it has been resolved, then this issue could be closed.)
3 remaining items
jklymak commentedon Apr 30, 2019
This is still a bug on master... Its obviously the superscript that is causing the problem, with the text bounding box not surrounding the superscript.
jklymak commentedon Apr 30, 2019
... same thing happens for a title.
[-]Axis label cut when saving .eps with bbox_inches="tight" but only when usetex=True[/-][+]Superscripts in axis label cut when saving .eps with bbox_inches="tight"[/+]jklymak commentedon Nov 16, 2021
I'll close this in favour of #21653, which is the same thing, but perhaps easier to follow (bug doesn't depend on clipping or eps, etc)