Repository navigation
The original xlim changed by twinx #6860
Description

- Matplotlib version: 1.4.3
- Python version: Python 2.7.11 :: Anaconda 2.3.0 (x86_64)
- Platform: OSX 10.11.5
The issue: when making a twinx of the original axis with xlim and ylim explicitly set, the twinx axis and the plotting actions that follow will change the xlim of the original plot. "Semantically", all the plots are still correct, but I doubt whether this is the intended behavior.
This can sometimes leads to serious confusions. One example is when the axis (and its twinx) is part of an axes grid, and when its xticklabels are set to be invisible (which is common in a regular grid of axes). In this case, plotting actions with twinx will change the x axis range implicitly and unknowingly, hence changing the alignment with other axes, making the quantitative interpretation of the plots impossible.
From the source code of twinx it is clear to me that the twinx only "inherits" the position of the original axis. I am thinking that it might be more helpful if it inherits all the properties of the original x axis.
See the following examples.
# This (x, y) pair will be used in all the following examples
x = array([-2, 0, 2, 4])
y = 0.3 * x + 0.2

fig = figure()
# This xlim and ylim are explicitly set, and I expect them not to be altered unless I explicitly do so.
ax = fig.add_axes((0.1,0.1,0.8,0.8), xlim=(0,2), ylim=(0,1), autoscalex_on=False, autoscaley_on=False)
ax.plot(x, y, color='blue', lw=10)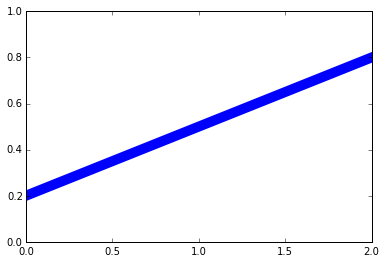
fig = figure()
ax = fig.add_axes((0.1,0.1,0.8,0.8), xlim=(0,2), ylim=(0,1), autoscalex_on=False, autoscaley_on=False)
ax.plot(x, y, color='blue', lw=10)
ax = twinx(ax)
ax.plot(x, y, color='red', lw=5)
# I would expect the two lines to overlap, but they don't.
# Both xlim and ylim are changed.
# Note that the blue line and the red line are still "semantically" correct.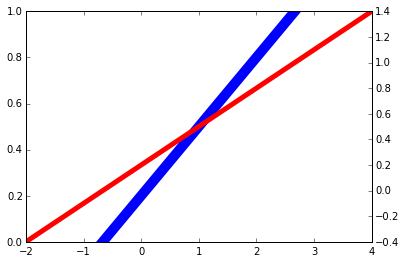
fig = figure()
ax = fig.add_axes((0.1,0.1,0.8,0.8), xlim=(0,2), ylim=(0,1), autoscalex_on=False, autoscaley_on=False)
ax.plot(x, y, color='blue', lw=10)
ax = twinx(ax)
ax.plot(x, y, color='red', lw=5)
ax.set_xlim((0,2))
# This one is acceptible, since the twinx axis has the same xlim as the original one,
# though I expected that this should be the default behavior (without manually setting xlim).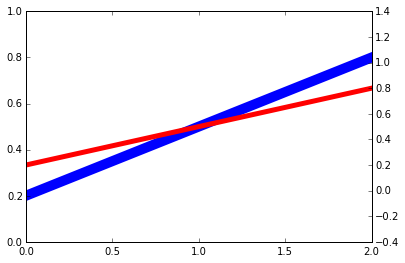
fig = figure()
ax = fig.add_axes((0.1,0.1,0.8,0.8), xlim=(0,2), ylim=(0,1), autoscalex_on=False, autoscaley_on=False)
ax.plot(x, y, color='blue', lw=10)
ax = twinx(ax)
ax.plot(x, y, color='red', lw=5)
ax.set_ylim((0,1))
# In this case the two lines overlap, but the original xlim is changed.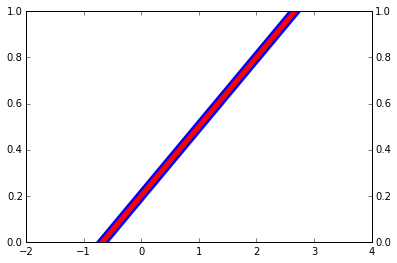
fig = figure()
ax = fig.add_axes((0.1,0.1,0.8,0.8), xlim=(0,2), ylim=(0,1), autoscalex_on=False, autoscaley_on=False)
ax.plot(x, y, color='blue', lw=10)
ax = twinx(ax)
ax.plot(x, y, color='red', lw=5)
ax.set_ylim((0,1))
ax.set_xlim((0,2))
# This is what I expected in the beginning.
# Basically, I do not expect the twinx to change the original xlim
# (and any other properties of the x axis).
Activity
[-]Unexpected behavior of twinx [/-][+]The original xlim changed by twinx[/+]tacaswell commentedon Aug 3, 2016
When making grids of axes that should share tick labels, it is best to use the
sharexandshareykwargs to keep the limits in sync (which avoids this problem); see theplt.subplotsdocs.In all cases the y-limit of the original
Axesdid not change.I think a pull request to copy the auto-scale state to the twined x-axis is a good idea, but do not think that propagating anything about the y-axis to the twin is a good idea.
LindyBalboa commentedon Aug 19, 2016
@tacaswell looking at the docs for plt.subplots that
sharextakes'row'andshareytakes'col'. Is there any case where those make sense? I don't believe so and would opt to eliminate those if possible.WeatherGod commentedon Aug 19, 2016
Sure, why wouldn't it? I can see why it might not be the case to do so most
of the time, but there isn't really any reason not to allow it.
On Fri, Aug 19, 2016 at 9:49 AM, Conner Phillips [email protected]
wrote:
LindyBalboa commentedon Aug 19, 2016
I was just seeing sharex/sharex in the context of reducing redundant axis labels. But thinking about it, it makes sense in the case of a small multiples layout.