Repository navigation
[ENH]: Support for custom/special ticks without complex workarounds #22262
Description

Problem
There is no direct, user-friendly method to add custom/special ticks. Existing methods can lead to surprising results and I have found little official guidance in the documentation that would account for this.
From what I have seen in the examples gallery and on the Internet, most solutions rely on Axes.set_xticks or Axes.set_yticks. These methods can fail silently (and very frustratingly) when attempting to work with e.g. a semilog plot.
Example of what would be expected behaviour with user set ticks (using ordinary plot):
import numpy as np
import matplotlib as mpl
import matplotlib.pyplot as plt


# Constants
L = 6
D = 1
gamma = 1
m_0 = 1
Delta_m = 0.05
q = gamma / D
r = np.sqrt(q)
Samples = 601

# Functions that should work with numbers and ndarrays just as well
def dervLin(xs):
    return xs * 0 -m_0 / L # Trick to make this ndarray-compatible (`xs * 0 +` forces array broadcasting, but doesn't change the value)

def dervExp(xs):
    return -m_0 * r * np.exp(-r * xs)

def dervPow(xs):
    return -12 * D / gamma / (xs + np.sqrt((6 * D / gamma) / m_0))**3


xs = np.linspace(0, L, Samples)
ys1 = Delta_m / np.abs(dervLin(xs))
ys2 = Delta_m / np.abs(dervExp(xs))
ys3 = Delta_m / np.abs(dervPow(xs))


fig, ax = plt.subplots(1, 1)
ax.set_xlim(0, L)
ax.plot(xs, ys1, xs, ys2, xs, ys3)
ax.hlines([ys1[-1], ys2[-1], ys3[-1]], 0, L, linewidth=0.5, linestyle="dashed", color="grey")
ax.set_yticks([ys1[-1], ys2[-1], ys3[-1]])
outputs
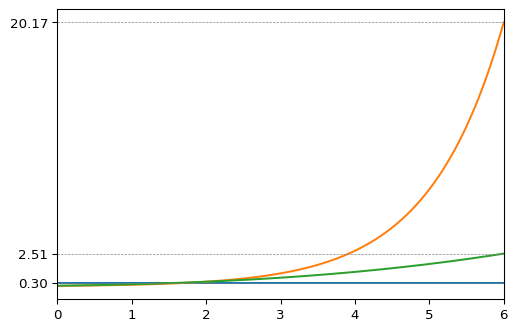
Now, trying the same with Axes.semilogy instead of Axes.plot:
import numpy as np
import matplotlib as mpl
import matplotlib.pyplot as plt


# Constants
L = 6
D = 1
gamma = 1
m_0 = 1
Delta_m = 0.05
q = gamma / D
r = np.sqrt(q)
Samples = 601

# Functions that should work with numbers and ndarrays just as well
def dervLin(xs):
    return xs * 0 -m_0 / L # Trick to make this ndarray-compatible (`xs * 0 +` forces array broadcasting, but doesn't change the value)

def dervExp(xs):
    return -m_0 * r * np.exp(-r * xs)

def dervPow(xs):
    return -12 * D / gamma / (xs + np.sqrt((6 * D / gamma) / m_0))**3


xs = np.linspace(0, L, Samples)
ys1 = Delta_m / np.abs(dervLin(xs))
ys2 = Delta_m / np.abs(dervExp(xs))
ys3 = Delta_m / np.abs(dervPow(xs))


fig, ax = plt.subplots(1, 1)
ax.set_xlim(0, L)
ax.semilogy(xs, ys1, xs, ys2, xs, ys3)
ax.hlines([ys1[-1], ys2[-1], ys3[-1]], 0, L, linewidth=0.5, linestyle="dashed", color="grey")
ax.set_yticks([ys1[-1], ys2[-1], ys3[-1]])
silently fails to produce labelled ticks:
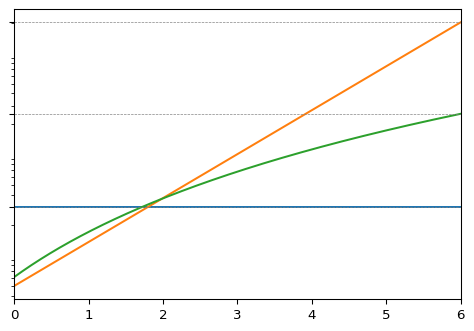
I have deduced that the problem lies with LogFormatterSciNotation, which doesn't produce a tick label when presented with user-provided values.
fmt = ax.yaxis.get_major_formatter()
>>> fmt
<matplotlib.ticker.LogFormatterSciNotation at 0x1d7a95a1940>
>>> fmt(0.3)
''
>>> fmt(10)
'$\\mathdefault{10^{1}}$'
My workaround includes subclassing and substituting the formatter:
class SpecialLogFmt(mpl.ticker.LogFormatterSciNotation):
    def __call__(self, x, pos):
        s = super().__call__(x, pos)

        if len(s) == 0:
            s = "%.2f" % x
        return s

sfmt = SpecialLogFmt()
ax.yaxis.set_major_formatter(sfmt)
Given these complications that necessitate a not completely trivial workaround, I believe it would be helpful to introduce explicit support for user-provided special ticks (in parallel to automatically-generated ticks). Other software e.g. OriginLab/OriginPro offers such a feature out of the box.
Proposed solution
At the very least, amend documentation of Axes.set_xticks/Axes.set_yticks to state that the results also depend on the Formatter of the axis, which may ignore the ticks which were added manually. Current documentation claiming that If not set, the labels show the data value. is misleading when this isn't mentioned.
Add a gallery example that shows how to use special ticks, with more emphasis on such edge cases as can occur with e.g. log plots.
If possible, create new API methods that would explicitly support manually-added special ticks, so that the user does not have to worry about making the axis formatter work with the custom ticks. This API could be connected with the hlines/vlines method to give horizontal/vertical lines ending in a special tick, which may be very helpful in some contexts.
Activity
jklymak commentedon Jan 18, 2022
If you need to manually label ticks because they are not part of the formatter then:
should work, plus or minus some formatting.
yaaun commentedon Jan 18, 2022
I originally stumbled upon this issue when attempting to add my own special ticks to those produced automatically. Then this issue can't be sidestepped as easily with
ax.set_yticks.What I would want to achieve would be to add the new ticks while preserving the old, automatically set ticks and their labels (as I am appending my new ticks/labels to the end of the array). Unfortunately, this is not what happens with the simple(r) solution above.
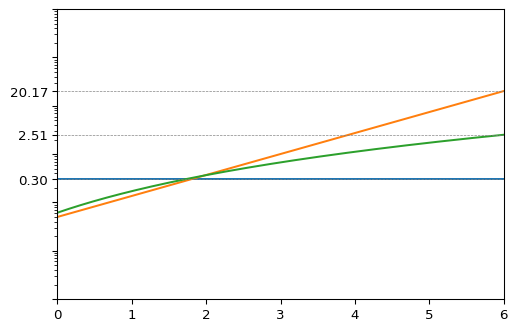
The new tick labels apparently clobber the old ones:
I am using matplotlib 3.5.1 (pip install) with Python 3.9.2 and Spyder 5.2.1 on Windows 10.
jklymak commentedon Jan 18, 2022
Yes, that is correct, you cannot mix and match custom and automatic ticks like this. If you want custom ticks, you must specify all the ticks - we don't allow more than one Locator or Formatter on an axis.
This is veering into user help, but you can easily add a secondary axis, and put whatever ticks you want on that. That is the approach I would take rather than trying to put new API on the already complicated axis ticker API. See https://matplotlib.org/stable/gallery/subplots_axes_and_figures/secondary_axis.html
oscargus commentedon Jan 19, 2022
Would it make sense (and be possible) that the
Formatterknows if the ticks are manually provided or not?I guess the empty string comes from here (or the corresponding non-Mathtext lines):
matplotlib/lib/matplotlib/ticker.py
Lines 1081 to 1084 in 612cfae
and somehow bypassing that should make things work more as may be expected.
jklymak commentedon Jan 19, 2022
@oscargus the major flaw of the Locator/Formatter dance is that the Formatter doesn't know anything about the Locator or the other ticks being formatted. Fixing that is a medium term project, but it is a tricky one if back compatibility is to be maintained.
Again, my recommended solution here is to use a secondary axis, which can also conveniently be on the right hand side, so it doesn't over plot on the scale on the left:
(If you want, it can be on the "left" as well, which is exactly what is being asked for here, but I really think that suffers from readability concerns)
Whether one calls this a "complex workaround" or not, it is logically much easier than trying to track manual and custom ticks, each with different formatting etc.
yaaun commentedon Jan 19, 2022
@jklymak
Ah, so I appear to have misunderstood the API completely and fallen into a trap. Some documentation would definitely be advisable to maybe help prevent others from repeating the same mistakes. I could maybe contribute some if that is acceptable.
Regarding the solution with the secondary axis: in my original use case, I had already used my secondary y axis for another unit scale, like this:

so that approach wouldn't work for me. In the end I used an
Axes.annotateelement to put some text with an arrow,From what I am gathering, solving this issue (i.e. adding special ticks to an axis – short of setting all ticks manually) straight on without wrestling the API would require the user to provide their own tick
LocatorandFormatterthat would both know (from somewhere else, e.g. by someSpecialLocator.add_tick(...)) about the special, user-set ticks. Nonetheless, this requires a fair bit of coding and knowledge of the internals of axis tick making – nothing impossible, but definitely not straightforward and maybe a bit too much to expect from the user... (?)jklymak commentedon Jan 19, 2022
You can have as many secondary axis-es as you want.
Adding extra ticks is not straightforward, so while I'm sure a clever API could be developed, I'm not convinced it would be worth it given the many other ways to annotate plots.
oscargus commentedon Jan 19, 2022
That should typically be very welcome (as far as my experience goes, not an official statement).
jklymak commentedon Jan 19, 2022
In general document improvements are very welcome. In this case perhaps an example of one does not already exist. Perhaps the docs for set_x/yticks should be made more explicit that they replace the locator (and maybe formatter) for the axis with a Fixedlocator and FixedFormatter and a note that they do not change the minor locator or formatter
Expanded the documentation even more based on discussion in issue mat…
Expanded documentation of Axis.set_ticks as per discussion in issue #…
subfigure _axstack property
anntzer commentedon May 7, 2024
Fixed by #22270, AFAICT. Feel free to ping for reopening otherwise.