Repository navigation
3D scatter plots don't work in logscale #209

Description

Original report at SourceForge, opened Fri Jun 10 12:29:24 2011
If you enable a log scale when doing a 3D scatter plot, nothing is created and the program crashes. Attached is the error output.
You can easily reproduce this by taking the example scatter3d_demo.py and adding the line "ax.set_xscale('log')".
SourceForge History
- On Fri Jun 10 12:29:40 2011, by qulogic: File Added: 414517: mpl-3d-log-error.txt
Reacted by Lucas Verney, Bernardo Augusto Godinho de Oliveira, Michael Lass, AEC.ai, Matt Conte, PorcelainMouse, sabian2008, laurathepluralized, Jonathan Louis Kaplan, Zhi Li and 30 more
Activity
WeatherGod commentedon Jun 22, 2011
Confirmed, however the problem is more nuanced than this. First, the problem does not error-out if one does
ax.w_xscale.set_scale('log'), however, this does not set the scale properly because the projection never takes it into account.Calling ax.set_xscale (or ax.set_yscale) appears to trigger some other stuff that leads to an error for displaying the coordinates in the corner. ax.set_zscale does not appear to exist. However, given that scaling does not appear to work properly right now, I am not inclined to add it.
gllort commentedon May 17, 2013
Problem seems to persist. I'm setting:
ax.xaxis.set_scale('log')
ax.yaxis.set_scale('log')
ax.zaxis.set_scale('log')
And then the ticks of the axes change to logarithmic scale:
While I'd expect the ticks to be equidistant and the data re-scaled, as it happens when using 2D plotting.
WeatherGod commentedon May 17, 2013
Well... it is better than it used to be. The issue is that there is a lot of code in mplot3d that just completely ignores the projection information of the axes. While significant progress has been made in axes3d.py, it is axis3d.py that still needs a lot of TLC.
gllort commentedon Oct 2, 2013
@Panchie I'm sorry I cannot shed more light into the issue, I didn't get it working and didn't find any solution googling around.
ibell commentedon Oct 3, 2013
+1 on this issue, stuck with exactly this problem
troyrock commentedon Nov 6, 2013
I would also like to see this issue resolved.
BenjAbecassis commentedon Nov 19, 2013
The problem is till there apparently. It is a big issue for me. I hope someone could resolve it soon.
hyperbowl commentedon Mar 16, 2014
any progress 3 years later? set_(x,y,z)scale still just sets axis labels, not axis scaling.
WeatherGod commentedon Mar 17, 2014
Unfortunately, no. I have not had the time or the resources to address this
issue. However, I would be more than happy to review any patches from those
who can figure this tough nut out.
On Sat, Mar 15, 2014 at 9:51 PM, hyperbowl [email protected] wrote:
OceanWolf commentedon Apr 15, 2015
-1, just kidding, the log won't work with that 😉.
The problem described sounds like a very simple problem, I mean as all the axes exist orthogonal to one another the problem should in theory exist no different for 3d as for 2d or for that matter any number of plotable dimensions. The fact that this problem has lasted so long tells me that the code says otherwise, in which case I imagine, as with a lot of the codebase, it needs a refactor, the good news I like doing.
The biggest problem though lies in the amount that needs refactoring. Starting at the base and working our way up, with bringing tools out of the backend (MEP 22) finished and general backend refactoring (MEP 27) on its way, I guess the main plotting functions will come next.
As @WeatherGod says, if anyone feels like jump in and looking through the code, then feel free (I only jumped in about a month or two ago myself), we can give guidance if needed and it works a lot better than +1s 😉.
tommyhlw commentedon May 6, 2015
how hard would it be to make a workaround which prevents all set_scale('log') in 3D and calls a module which calculates the affected data array log (e.g. np.log(data) ) and changes the ticks labels to decimal power?
As long the bug exists a patch like this could help.
I will try to add an extra module in my 3D Scripts, where the data and fixed scale values will be modified, sth like this:
def scalelog(scale,scalename):
newscale = []
newscale = np.power(10,scale)
if scalename=='x':
plt.xticks(scale,newscale)
if scalename=='y':
plt.yticks(scale,newscale)
if scalename=='z':
plt.zticks(scale,newscale)
scalelog([1,2,3,4],'z')
ax.scatter(xs., ys, np.log(zs), c=c, marker=m)
Teque5 commentedon Aug 25, 2015
4 year old bug
workaround:
14 remaining items
scottshambaugh commentedon Apr 14, 2023
Played around with this today. The below shows that the grid and ticks are having their data coordinates calculated correctly.
Left 2D, right 3D.
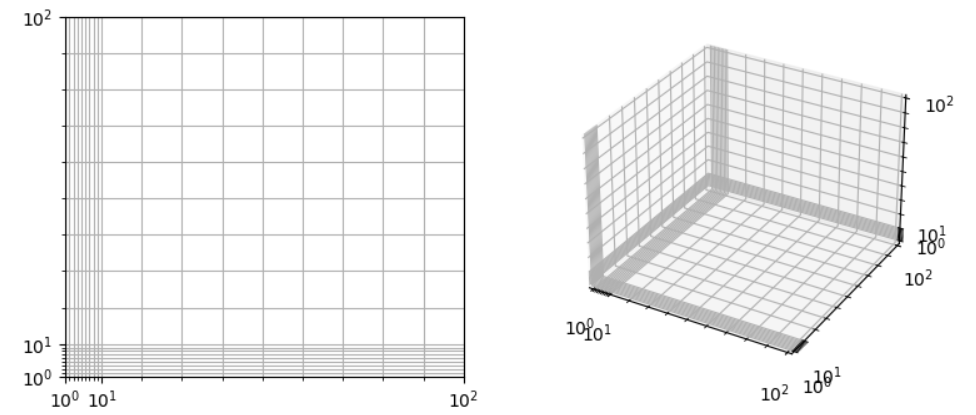
However, everything falls apart when I switch from

ax.xaxis._set_scale('log')to the properax.set_xscale('log'). My impression is that axis3d and axes3d aren't using the transformations at all when doing their calculations, and that'll need to be added in. In other words, there needs to be a separation within all the 3D code between world coordinates and data coordinates. I'm out of my depth to solve this right now, will need someone familiar with how 2D transformations work to be able to implement this. Leaving this info in case these breadcrumbs help anyone.2sn commentedon Jun 3, 2023
It is very unfortunate that the 3D projection behaves differently from the 2D "projection". Makes it hard to write code that is transparent w/r dimensionality of axes.
AxelAublet commentedon Nov 2, 2023
Hi, is there any news about this issue or is this still an open subject ?
Teque5 commentedon Nov 4, 2023
Unfortunately this bug and many others #12620 are a decade old and nobody understands the 3d plotter internals enough to fix. Mayavi seems to be everyone's favorite alternative for 3d, although the interface is super janky compared to matplotlib. Recently I've taken to exporting these kinds of plots to Blender.
zacklyda commentedon Jul 16, 2024
Thirteen years later, I'm having the same issue. Hope this gets solved eventually, matplotlib is great otherwise!
trananso commentedon Aug 5, 2024
I gave it my best shot, but am unable to continue working on it. If anyone wants to build on it, be my guest! 🙂
rcomer commentedon Aug 5, 2024
Thank you for your efforts @AnsonTran!
katonage commentedon Mar 27, 2025
I wish this function would work.
Meanwhie: as said aboves it is possible to cicumvent the problem by putting log10(z) in z and with these tweaking grid and text:
This would produce axis like this:
PaulCreusy commentedon Aug 9, 2025
Since many people seem to have the problem and it could not be solved in clean way, could it be possible to add the workaround with formatter, locator and ticks as default behavior whenever a log scale is used for a 3D projection ?
scottshambaugh commentedon Aug 9, 2025
@PaulCreusy we would not want to codify a bandaid fiz. But I think that if someone wants to put together a gallery example that shows this workaround to get log axes in 3d in the meantime, it would be very welcome.
scottshambaugh commentedon Jun 14, 2026
This is now available with the release of v3.11. Please see this gallery example for a usage demo: https://matplotlib.org/stable/gallery/mplot3d/scales3d.html