Repository navigation
Some short lines added with plot() are missing in the PNG output depending on DPI #20192
Description

Bug report
Depending on DPI, a figure saved as PNG is missing some short lines.
Code for reproduction
import matplotlib
from matplotlib import pyplot as plt
import numpy as np

matplotlib.use('agg')

# Generate a set of 50 random points.
np.random.seed(0)
all_x, all_y = (np.random.rand(50) for _ in range(2))

# Scatter dots in blue.
plt.scatter(all_x, all_y, c='blue', s=2)

# Plot very short lines (length 0.001) in red with a small offset on Y.
for x, y in zip(all_x, all_y):
    plt.plot((x, x + 0.001), (y + 0.01, y + 0.01), c='red', linewidth=2)

# Save with different resolutions
plt.savefig('bug_96.png', dpi=96)
plt.savefig('bug_300.png', dpi=300)
Actual outcome
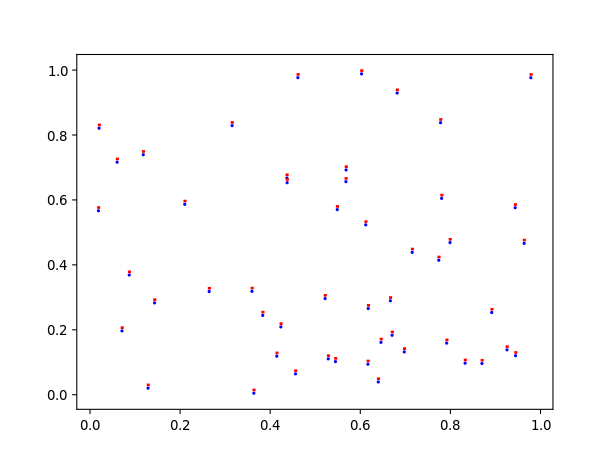
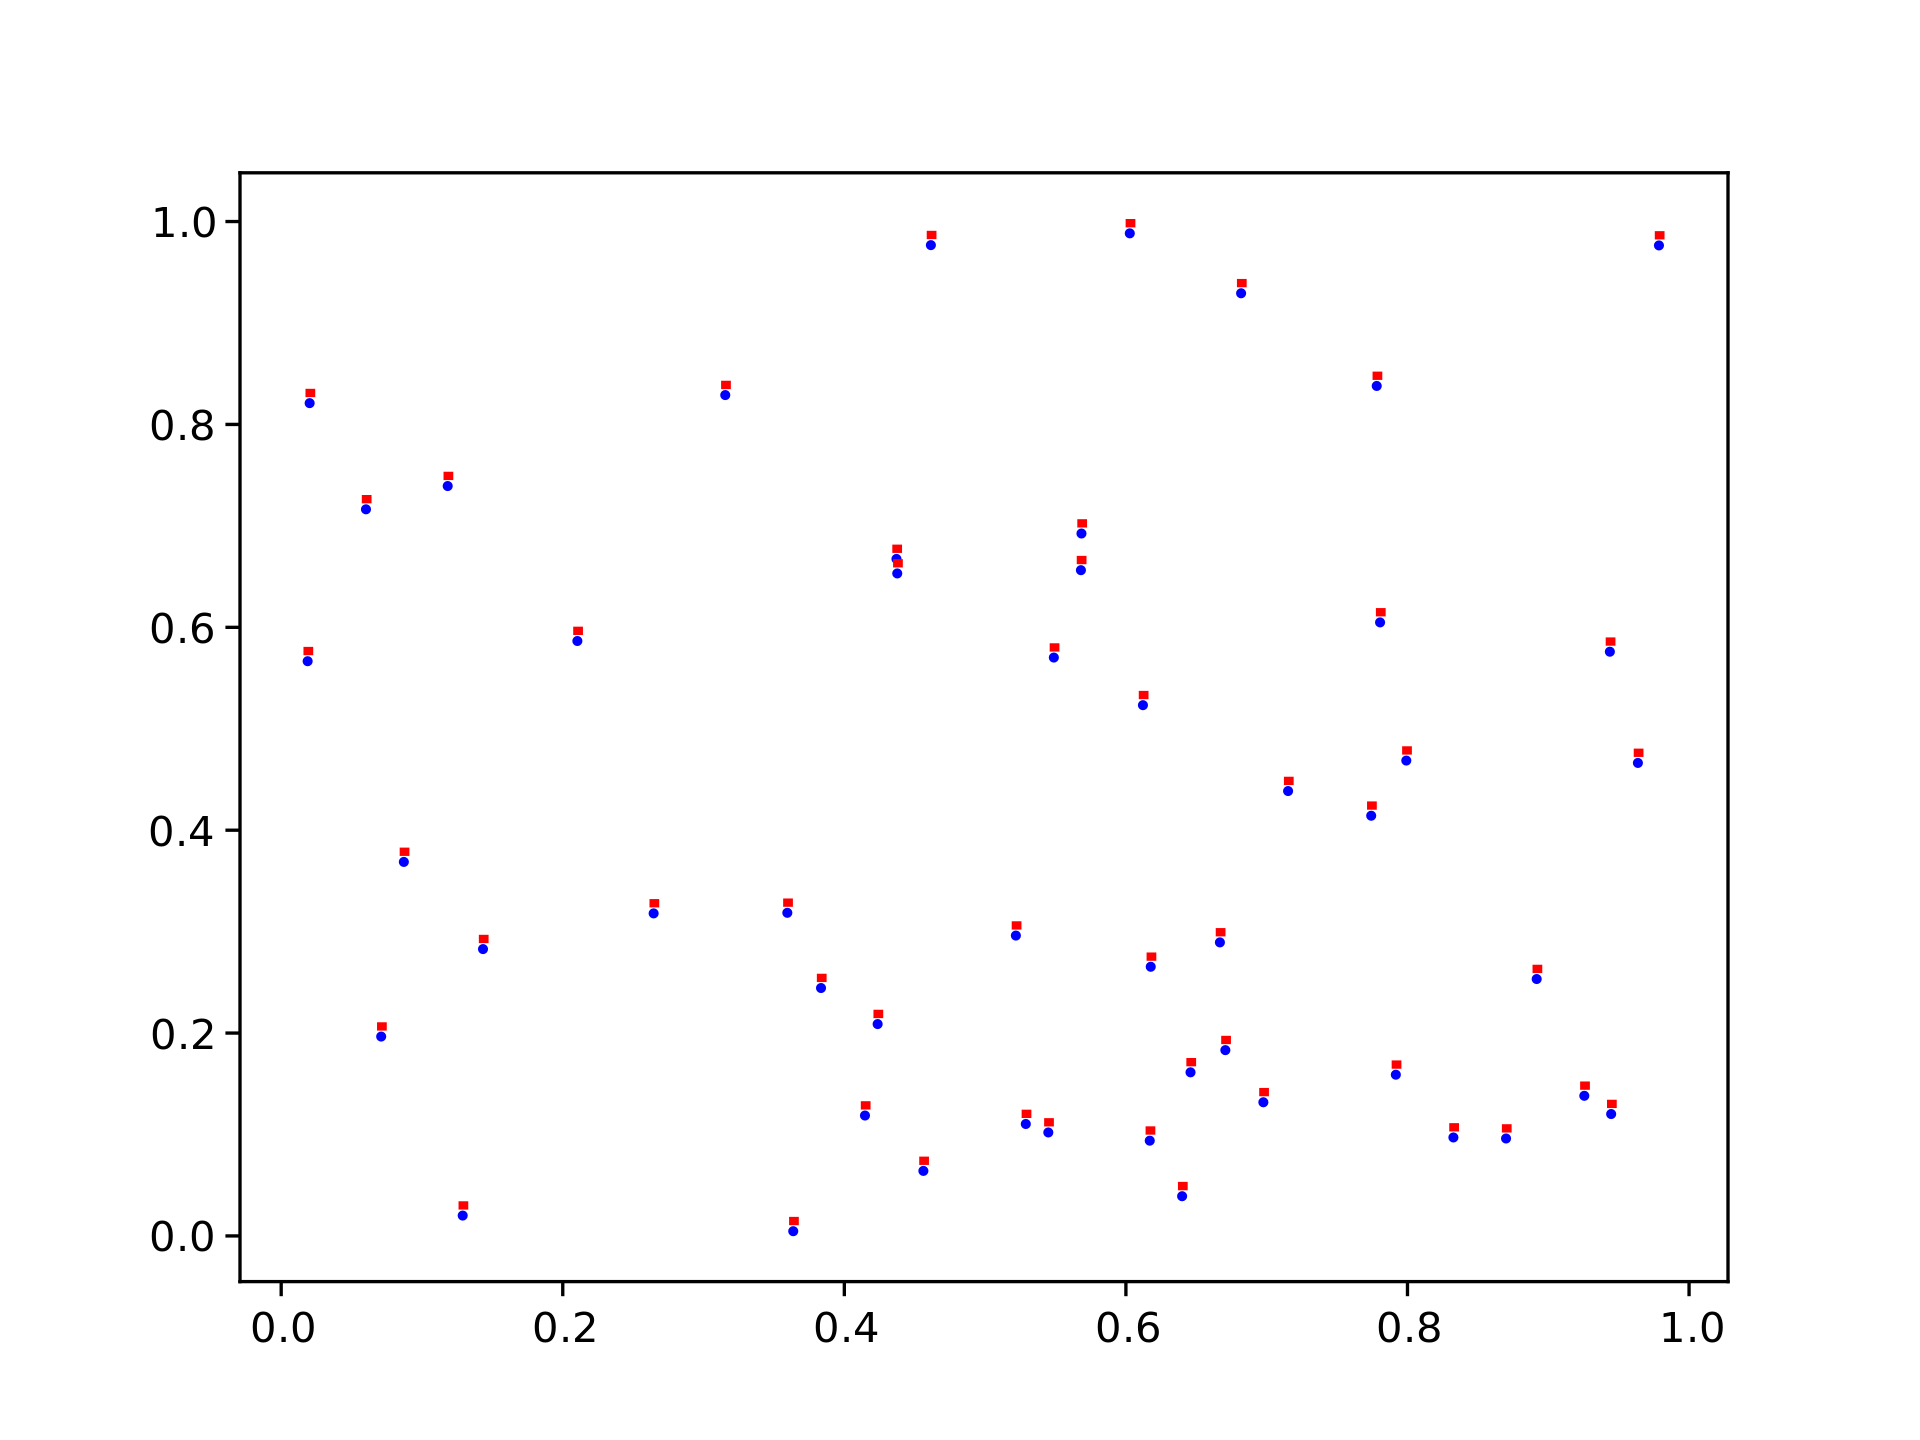
Depending on export DPI, some short segments (in red, added by plot()) are missing, while all dots (in blue, added by scatter() are always present).
At 96 DPI:

At 300 DPI:

Expected outcome
The segments should be always present, regardless of the resolution.
Matplotlib version
- Operating system: Ubuntu 20.04.2 LTS
- Matplotlib version (
import matplotlib; print(matplotlib.__version__)): 3.4.2 - Matplotlib backend (
print(matplotlib.get_backend())):agg - Python version: 3.8.5
Python is installed via apt-get, Matplotlib installed system-wide using PIP.
Activity
tskir commentedon May 9, 2021
Interestingly enough, the bug disappears with
matplotlib.use('cairo').At 96 DPI with cairo:
At 300 DPI with cairo:
jklymak commentedon May 9, 2021
If you turn snapping off this is fixed.
plot(....snap=False)jklymak commentedon May 9, 2021
FWIW, I think snapping for ticks makes some sense. I don't think there are many situations where having snapping on for other artists is a good idea at all. I'm not familiar enough with matplotlib's history wrt snapping, but it seems a bad idea in general.
I also recommend strongly getting around any bad ideas matplotlib may have had by saving at relatively high dpi and then using a graphics package to reduce the size optically. In my opinion we try to do too many "smart" things with low resolution images that really should be done in post-processing, not while we compose the images.
tskir commentedon May 9, 2021
@jklymak Indeed, thank you very much for the pointer and for such a quick reply!
I'll apply this fix, and will leave this issue up for any related discussions.
github-actions commentedon Oct 20, 2025
This issue has been marked "inactive" because it has been 365 days since the last comment. If this issue is still present in recent Matplotlib releases, or the feature request is still wanted, please leave a comment and this label will be removed. If there are no updates in another 30 days, this issue will be automatically closed, but you are free to re-open or create a new issue if needed. We value issue reports, and this procedure is meant to help us resurface and prioritize issues that have not been addressed yet, not make them disappear. Thanks for your help!
tacaswell commentedon Oct 20, 2025
I have somewhat mixed thoughts on this. On one hand, snapping things out of existence is bad, but on the other what is getting rendered in this case is relatively miss-leading
The snapping code only kicks in on paths if the lines are only horizontal or vertical which this case does hit. This is to make sure a bunch of long horizontal lines all look the same weight. Think of a 2 pixel wide line, if the path goes down the boundary between two pixels you get a 2 pixel wide 100% color rendering. If the path goes down the center of a pixel, then you get a 3 pixel wide line with the center row being 100% and the outer pixels being 50% (due to anti-aliasing) or a 3 pixel wide line (if you turn off AA). These defaults were decided back before high-dpi screens existed so (what we now call) low-dpi was pretty important.
On the other hand, what is being rendered for the lines is mostly the caps not the actual line (setting
solid_capstyle='butt'shows this), however in that case we are still seeing the same issue.I think the right fix is to add logic in
matplotlib/src/path_converters.h
Lines 559 to 599 in 9b61b47
This patch seems to fix the problem, but have not tested what other consequences this has.