SymLogNorm and SymLogScale give inconsistent results.... #16376
Description
on master....
import matplotlib.pyplot as plt
import numpy as np
import matplotlib.scale as mscale
import matplotlib.colors as mcolors
#scale = mscale.SymmetricalLogScale(ax.xaxis, linthreshx=1.0)
fig, ax =plt.subplots()
ax.set_xscale('symlog', linthreshx=1.0, linscale=1)
ax.plot(np.arange(-100, 100, 0.1), np.arange(-100, 100, 0.1))
ax.set_xlim([-100, 100])
scale = ax.xaxis._scale
norm = mcolors.SymLogNorm(linthresh=1.0, linscale=1, vmin=-100, vmax=100)
xx = scale._transform.transform([-200, -100, -10, -1, -0.5, 0, 0.5, 1, 10, 100, 200])
print((xx - xx[1])/(xx[-2] - xx[1]))
print(norm([-200, -100, -10, -1, -0.5, 0, 0.5, 1, 10, 100, 200]))
fig, ax = plt.subplots()
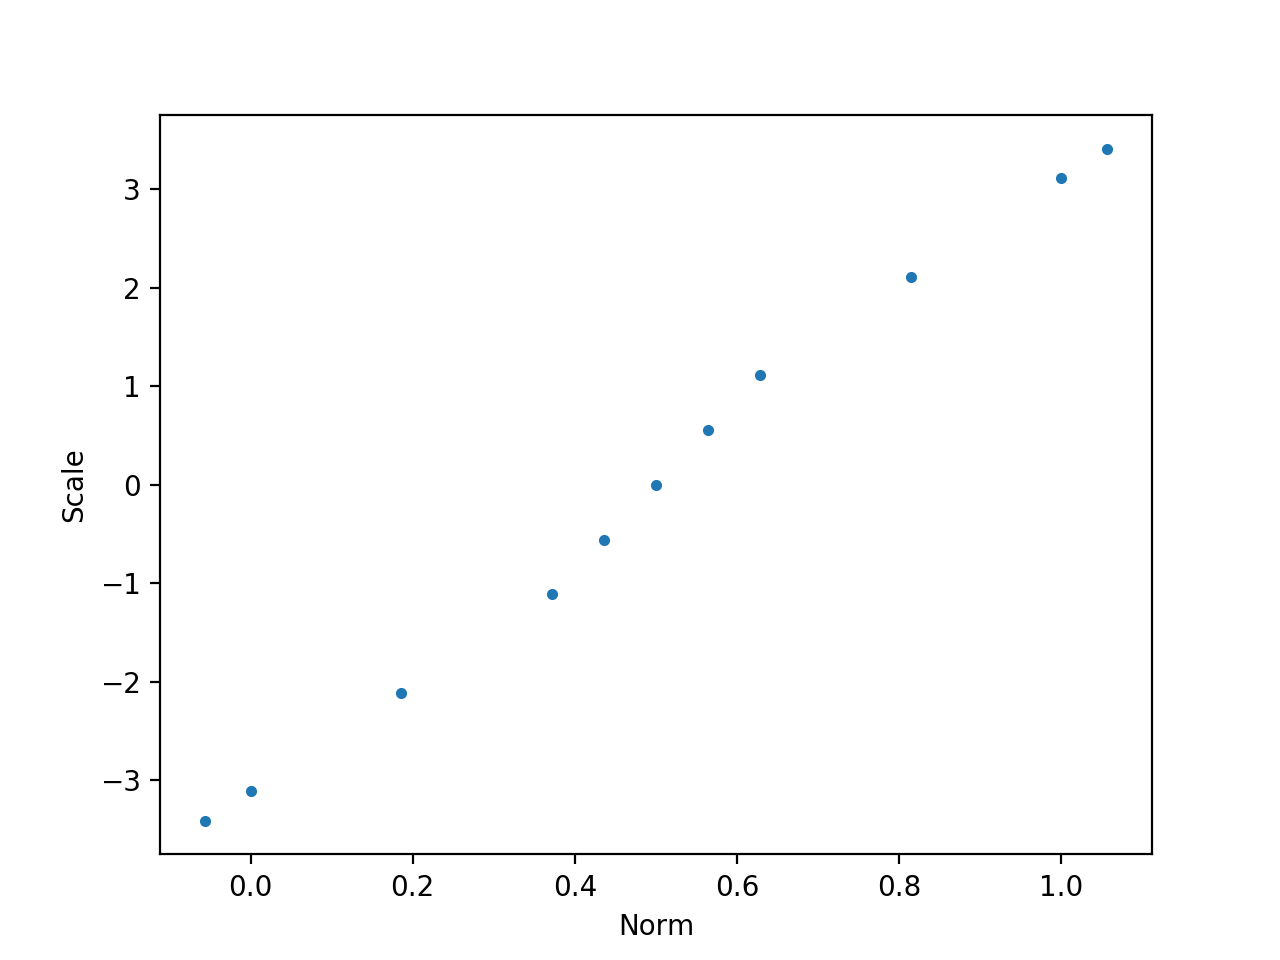
ax.plot(norm([-200, -100, -10, -1, -0.5, 0, 0.5, 1, 10, 100, 200]), xx, '.')
ax.set_xlabel('Norm')
ax.set_ylabel('Scale')yields
[-0.0483798207317112 0.0 0.1607142857142857 0.3214285714285714
 0.4107142857142857 0.5 0.5892857142857143 0.6785714285714286
 0.8392857142857143 1.0 1.0483798207317112]   # scale
[-0.05601509  0.          0.1860781   0.3721562   0.4360781   0.5
  0.5639219   0.6278438   0.8139219   1.          1.05601509]  # Norm
I think scale is right, and norm is wrong...