Path3DCollection from 3D scatter cannot set_color #13035
Description

Bug report
Bug summary
The set_color method on the Path3DCollection object, such as the one returned by 3D scatter plot, does not set the color. I am filing this as a new issue because
- all previous instances reported the issue as related to the figure not being updated / redrawn
- previous reports date back more than 3 years and to version 1.3.1
- the MWE here shows the issue is present even before the first display (
showcall) of the figure - this report describes some other anomalies related to
alphathat might favorable to handle together
Code for reproduction
# Can we change color after plotting? NO, independently of the color format.
# Note: in 2D set_color() works as expected.
import matplotlib.pyplot as plt
from mpl_toolkits.mplot3d import Axes3D
fig = plt.figure()
ax = fig.gca(projection = "3d")
sc1 = ax.scatter([0,1], [0,1], [1,1], color = (1,0,0,1), depthshade = False)
sc2 = ax.scatter([0,1], [0,1], [2,2], color = (1,0,0,1), alpha=0.3, depthshade = True)
sc3 = ax.scatter([0,1], [0,1], [3,3], color = (1,0,0,1), alpha=1.0, depthshade = False)
sc4 = ax.scatter([0,1], [0,1], [4,4], color = (1,0,0,0.3), alpha=1.0, depthshade = True)
sc1.set_color('blue')
sc2.set_color(['blue', 'blue'])
sc3.set_color([(0,0,1), (0,0,1)])
sc4.set_color([(0,0,1,1), (0,0,1,1)])
sc1.changed()  # workaround https://stackoverflow.com/a/8974087 does not work here
ax.set_zticks([1,2,3,4])
ax.set_zticklabels(['"blue"', '[b,b]', 'RGB', 'RGBA'])
fig.show()
Actual outcome
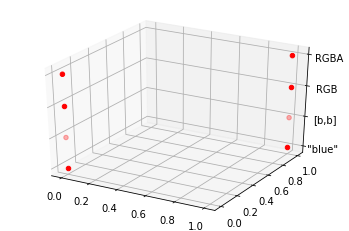
While all the scatter plots are expected to have blue color.
Related questions
If the issue is coming from how Axes3D.scatter produces the Path3DCollection, it might be worthy to note the following on the color-related alpha channel.
Context: Does depthshade work with alpha value?
- NO, depthshade is negatively overridden if alpha is provided, in addition, channel A from RGBA colors is omitted.
- Remark: Since I did not find any note on this alpha vs channel A interaction in the docs, my expectation was to display using the product of alpha and A. Remark holds for 2D as well.
fig = plt.figure()
ax = fig.gca(projection = "3d")
sc1 = ax.scatter([0,1], [0,1], [1,1], color = (1,0,0,1), depthshade = False)
sc2 = ax.scatter([0,1], [0,1], [2,2], color = (1,0,0,1), alpha=0.3, depthshade = True)
sc3 = ax.scatter([0,1], [0,1], [3,3], color = (1,0,0,1), alpha=1.0, depthshade = False)
sc4 = ax.scatter([0,1], [0,1], [4,4], color = (1,0,0,0.3), alpha=1.0, depthshade = True)
ax.set_zticks([1,2,3,4])
ax.set_zticklabels(['A=N a=1', 'A=1 a=.3', 'A=1 a=1', 'A=.3 a=1'])
fig.show()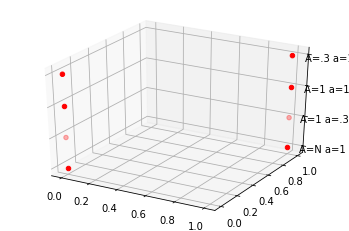
Question: Can we change alpha after plotting?
- YES, independently of how alpha was provided.
- Note:
set_alpha()must be called with single scalar, otherwise aTypeErrorexception is raised. - Note: it seems that both the scatter constructor and set_alpha writes alpha into the color code because of the following
set_alpha(None)does not restore alpha to 1.0, but reverts the negative override on depthscaleset_alpha(1.0)overrides the A channel of RGBA colors
- Remark: the above behavior is inconsistent with line plotting for the following reasons:
- there,
set_alpha(None)reverts only the explicitly provided alpha, not the A channel of RGBA colors - there,
set_alpha(1.0)does not overwrite the A channel of RGBA colors, but the minimum of the alpha and A is used, however I would prefer product over minimum.
- there,
fig = plt.figure()
ax = fig.gca(projection = "3d")
sc1 = ax.scatter([0,1], [0,1], [1,1], color = (1,0,0,1), alpha=0.3, depthshade = True)
sc2 = ax.scatter([0,1], [0,1], [2,2], color = (1,0,0,1), alpha=0.3, depthshade = True)
sc3 = ax.scatter([0,1], [0,1], [3,3], color = (1,0,0,0.3), depthshade = True)
sc4 = ax.scatter([0,1], [0,1], [4,4], color = (1,0,0,0.3), depthshade = True)
sc1.set_alpha(1.0)
sc2.set_alpha(None)
sc3.set_alpha(None)
sc4.set_alpha(1.0)
ax.set_zticks([1,2,3,4])
ax.set_zticklabels(['a=.3->1', 'a=.3->N', 'A=.3->N', 'A=.3->1'])
fig.show()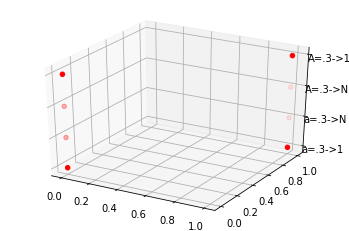
Matplotlib version
- Operating system: Windows
- Matplotlib version: 3.0.2
- Matplotlib backend: both module://ipykernel.pylab.backend_inline and Qt5
- Python version: 3.6.7 |Anaconda custom (64-bit)| (default, Dec 10 2018, 20:35:02) [MSC v.1915 64 bit (AMD64)]
Activity
stippingerm commentedon Dec 21, 2018
@WeatherGod There was a similar issue for
Patch3DCollectioninstead ofPath3DCollection.stippingerm commentedon Jan 8, 2019
@tacaswell, @xiaoshiqi and @jinshifen33 this may be related to #9725 too, but please consider the additional examples and context given here.
stippingerm commentedon Jan 10, 2019
After some digging, I (re)discovered that the bug is due to the
set_facecolornot setting_facecolor3dbecause it is inherited from the base class (Collection) setting_facecolors. The same for edge colors. I found that PR #5598 (still not applied?) should solve the main issue ofset_facecolorandset_edgecolornot working, however those classes may need special attention that use_facecolor2dinstead of_facecolors. Workaround till then is to callset_3d_properties(stored_z_coords, 'z')after anyset_color.What remains is the interplay with collection-level alpha.