Repository navigation
fig.set_dpi() does not set the dpi correctly #11227

Description

Bug report
Bug summary
Changing the figure's dpi via fig.set_dpi() does not have the desired effect. There are strange things happening when saving or showing the figure as detailed below.
Bug 1 - saving
In the following a figure with dpi=200 should be saved in all 3 cases.
import matplotlib.pyplot as plt

get_img_size = lambda path: print(plt.imread(path).shape)

fig1, ax1 = plt.subplots(dpi=200)
ax1.plot([1,2])
fig1.savefig("fig1.png")
get_img_size("fig1.png")

fig2, ax2 = plt.subplots(dpi=100)
ax2.plot([1,2])
fig2.savefig("fig2.png", dpi=200)
get_img_size("fig2.png")

fig3, ax3 = plt.subplots(dpi=100)
ax3.plot([1,2])
fig3.set_dpi(200)
fig3.savefig("fig3.png", dpi="figure")
get_img_size("fig3.png")
Qt5Agg
The outcome using the Qt5Agg backend of this is
(960, 1280, 4)
(960, 1280, 4)
(480, 640, 4)
i.e. in the first two cases we get the expected 200 dpi figure. In the last case, where the figure dpi is set via fig.set_dpi it seems to be ignored and the output image has a dpi of 100.
TkAgg
Using the TkAgg backend, the saved figures are as expected ((960, 1280, 4) in all cases.)
Bug 2 - showing
In the following we would expect to get two identical figures shown, both with dpi=100 and 640x480 pixels large.
plt.close("all")

fig1, ax1 = plt.subplots(num="expected", dpi=100)
ax1.plot([1,2])

fig3, ax3 = plt.subplots(num="buggy", dpi=50)
ax3.plot([1,2])
fig3.set_dpi(100)
print(fig3.get_dpi())
fig3.savefig("fig3a.png", dpi="figure")
print(fig3.get_dpi())
plt.show()
print(fig3.get_dpi())
Qt5Agg
The output (with Qt5Agg) is the following:
100
100
50
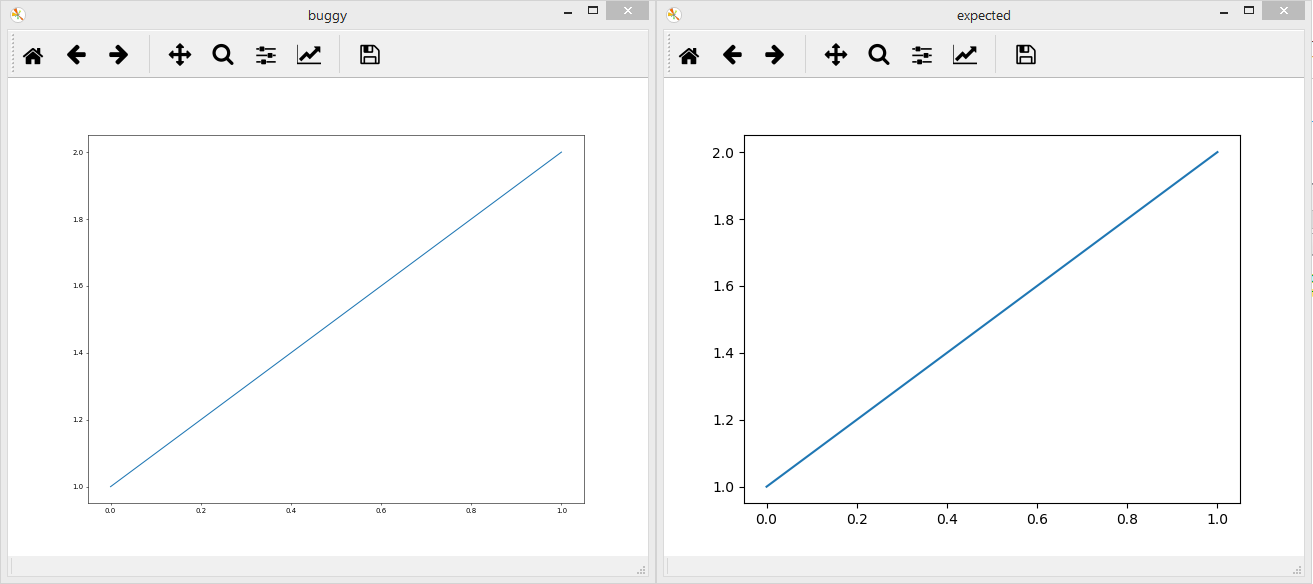
The printed dpi is correctly 100 before showing the figure. After showing, it prints 50. The shown figures have both the correct size, but the figure where dpi is set via fig.set_dpi has narrower linewidth and smaller fontsize. It looks exaclty like a figure that would have been expected for dpi=50, just with the wrong pixel size.
TkAgg
Using TkAgg backend, the output is correctly printed as 100 in all cases, but the shown figures differ in size; the left (expected) figure is 640x480 pixels, while the right figure is 640x445 pixels.

Matplotlib version
- Operating system: Windows 8.1
- Matplotlib version: master (2.2.2.post1088.dev0+g9ec4b95d6)
- Matplotlib backend: Qt5Agg & TkAgg (see text)
- Python version: 3.6.4
Running the same with matplotlib 2.0.2 (all other versions the same) I get
Qt5Agg, saving: (960, 1280, 4), (960, 1280, 4), (480, 640, 4) - same bug as above with master.
Qt5Agg, showing 100, 100, 100 - printed dpi are all the same, shown figures are the same.
TkAgg, saving: (960, 1280, 4) in all cases. - same expected behaviour as above.
TkAgg, showing 100, 100, 100 - printed dpi are all the same, shown figures differ in same manner as above.
Activity
jklymak commentedon May 11, 2018
yes exhibit A as to why setting the figure dpi before rendering make our lives a lot harder. I had similar bug reports 6 months ago.
ImportanceOfBeingErnest commentedon May 11, 2018
Apparently they still haven't been solved? Are they duplicates?
tacaswell commentedon May 11, 2018
Some of this is due to the high-dpi support for Qt which effectively renders the figure at double resolution for the screen (this is due to the way that GUI frameworks deal with high-dpi, they default to using a 2x2 pixel grid for your images unless you explicitly ask it to give you access to the screen resolution). To keep the figure the correct size on the screen and the fonts at the expected size. There are a number of some what fragile latches to keep track of the 'real' and 'screen' DPI and to cope with the user moving the window from a low to a high dpi screen etc. Some of these rely on callbacks from the Qt side to fire to work correctly (see the comments in https://github.com/matplotlib/matplotlib/blob/master/lib/matplotlib/tests/test_backend_qt5.py#L94 ).
You are running these as
python script.py? I suspect running these interactively in IPython would give different results (due to the Qt event loop running in the background).The Tk one looks like a bug in the Tk window resize code (we need to set the window to be the size of the plot + the size of the toolbar, looks like we are missing the correction is the case of changing the DPI)
ImportanceOfBeingErnest commentedon May 11, 2018
I tested everything via
python script.py. But I observe the same when running them in Spyder via the IPython Qt console (which is how I usually work with python); I suppose that would be the same as typingrunfile(script.py)into IPyton. Does that qualify as "interactively" or do you mean something else?ImportanceOfBeingErnest commentedon May 11, 2018
The high-res stuff might explain the problems of Bug 2 I suppose. But if there is no figure shown at all, none of this should take any effect, right?
jklymak commentedon May 11, 2018
For figure:
So I think if you don't specify the dpi it'll fall back to the default, so that is your first case. Why it does something different for tk is beyond me...
EDIT oops sorry I see you specified dpi=figure. Well that is mysterious.
jklymak commentedon May 11, 2018
For
plt.showthe question is what do we expect to see if you have set the figure dpi to something different than your screen resolution?ImportanceOfBeingErnest commentedon May 11, 2018
Uh, so there is even another bug? Because the first two figures are identical. I thought this to be expected because I assumed the default to be "figure", but if it isn't then the first figure should have a dpi of 100 instead of 200.
But you may simply plug
dpi="figure"into the first savefig command; the complete bug report stays valid.tacaswell commentedon May 11, 2018
No, the first two are correct because for the first one you are setting the figure DPI to 200 (which will render to the screen at 400) and save at 200, in the second case you are telling savefig to use 200 DPI (which it is). The third case is exposing a race condition someplace between the figure state and the GUI state.
ImportanceOfBeingErnest commentedon May 11, 2018
What the heck does "screen resolution" mean here? I'm not measuring anything with a ruler on my screen. But just because you are asking, I have a 1920x1080 pixel monitor with a diagonal of 27 inch, hence my screen resolution is
sqrt(1920^2+1080^2)/27. = 82 ppi.Nice to know - but completely unrelated to the bug report.
ImportanceOfBeingErnest commentedon May 11, 2018
This does not make any sense to me at all. Where is the number 400 coming from? And why should it save at 200 dpi, if - as the documentation states - the default rcParam is used,
which is 100which is"figure"?But as I said, feel free to replace the respective line by
fig1.savefig("fig1.png", dpi="figure"), the complete bug report stays valid.jklymak commentedon May 11, 2018
Again I ask. What is the point of setting the figure dpi before print time? It’s not documented so far as I can see
jklymak commentedon May 11, 2018
OK, so on hi-dpi my machine using Qt5Agg
prints
100but yields the original 50 dpiIf I change the original dpi to 30:
fig3, ax3 = plt.subplots(num="buggy", dpi=30)So it makes the window 50% the size of the default window in both cases, and then makes the lines thinner according to the original figure dpi.
If I do
I get the bigger window, but still at the fuzzier resolution.
tacaswell commentedon May 11, 2018
The high-dpi GUI frameworks need a double-resolution image for painting to the screen. It is rather annoying, but it is the way it is (you can dig up quite a few comments from me about a year ago complaining vociferously about this, but I have moved on to acceptance).
The default value of `savefig.dpi' is 'figure'.
matplotlib/lib/matplotlib/figure.py
Line 1852 in 9ec4b95
matplotlib/lib/matplotlib/rcsetup.py
Line 1347 in 9ec4b95
which eventually falls through to backend bases
matplotlib/lib/matplotlib/backend_bases.py
Lines 2147 to 2148 in 9ec4b95
to resolve the string to a number. Note that this looks for an optional
_original_dpiattribute on the figure which is setmatplotlib/lib/matplotlib/backends/backend_qt5.py
Line 232 in 9ec4b95
and similarly in webagg. However it is not updated when
set_dpiis called which is likely the source of the bug.@jklymak Either we set the dpi at the figure level and fold it into the transform stack or we would have to pass the dpi into every single backend draw method. We also use the dpi + figure size to sort out how big to make the gui windows.
12 remaining items
BearBearCodes commentedon Dec 6, 2022
I am experiencing a similar issue on
matplotlib 3.5.2withpython 3.10.4running on WSL2 with Ubuntu 20.04.5 LTS.EDIT: I am using TkAgg as my backend
tl;dr:
fig.set_dpi(150)only changes the dpi of plot shown in the Jupyter notebook but not in the saved figurefigure.dpiin thematplotlibrcfile does not work at allplt.subplots(dpi=150)changes the dpi of both the plot shown in the Jupyter notebook as well as in the saved figureMore details:
When I run the following code in a Jupyter notebook running
IPython 8.1.1,I find that the Jupyter preview window reflects the increased DPI but the saved figure does NOT respect the changed dpi (it is still at the default 72 dpi).
Moreover, I'm finding that on my machine, the
figure.dpircParam is not respected after I have modified it in mymatplotlibrcfile (located at~/.config/matplotlib/matplotlibrc). Other changes to options likeaxes.prop_cyclein mymatplotlibrcfile are being reflected in the plots shown in the Jupyter notebook as well as in those saved viafig.savefig(), but changes to thefigure.dpioption are not reflected in the plots shown/saved. Note that if I instead set the dpi viaplt.subplots(dpi=150), then the plots shown/saved both have a dpi of 150, as expected.tacaswell commentedon Dec 6, 2022
@BearBearCodes Can you please check the value of
mpl.rcParams['savefig.dpi']?I do not understand what you mean by "jupyter preview window" and our default dpi has been 100 from mpl2.
Can you reproduce this issues with complete stand alone script (including imports) and no
mplrcparamsfile?jklymak commentedon Dec 6, 2022
Actually let's close this, since DPI handling in most of the backends has changed significantly. @BearBearCodes if you can open a new issue with all the required information, that would be more clear. Thanks!
BearBearCodes commentedon Dec 6, 2022
Hi @tacaswell, thanks for your quick response and apologies for the confusion.
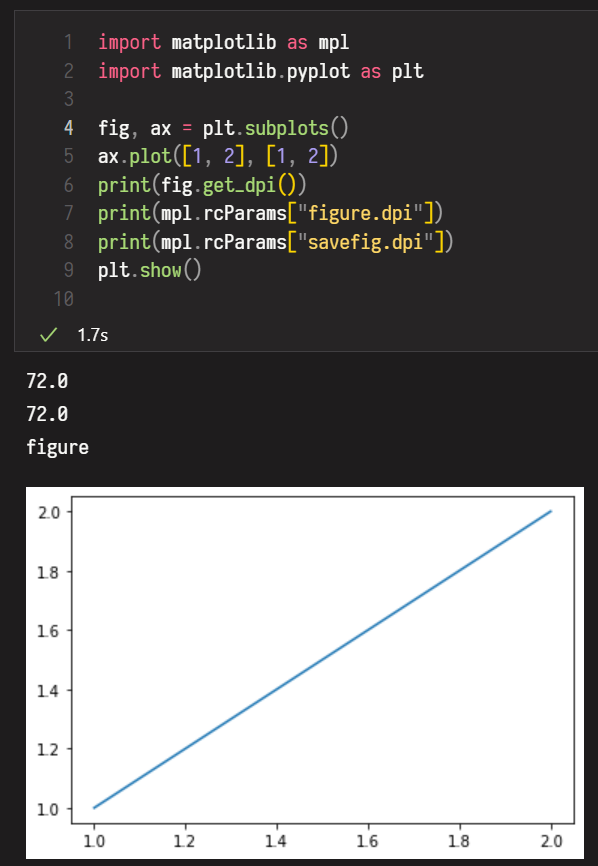
By "jupyter preview window", I just mean the output you see under the Jupyter code cell after executing the code in that cell. A screenshot of what I mean is below.
Also as you can see in the screenshot, the
mpl.rcParams["savefig.dpi"]option is set tofigureand the figure's dpi is set to 72. This is with no matplotlibrc file.Interestingly, if I run the exact same code seen in the screenshot above in a python file rather than in a Jupyter notebook, the default figure dpi is 100. But if I change the dpi to, e.g., 150 using the following code in a standalone python file
then the saved figure is still at 100 dpi rather than 150.
BearBearCodes commentedon Dec 6, 2022
Okay I will do that. Thank you!
jklymak commentedon Dec 6, 2022
Sorry for the crossed posts. Please also be careful to use the same python environment to start Jupyter and run the standalone scripts.
BearBearCodes commentedon Dec 6, 2022
@jklymak yep I am using running both the Jupyter notebook and the standalone python script from a conda environment.