Repository navigation
Bar plot does not work #10130
Description

Bug report
Bug summary
Bar plots do not work. The call chain of the error is too complicated for me to understand what is the issue so that's all I can say.
Code for reproduction
For example this example code. I'm running it from a jupyter notebook.
Actual outcome
---------------------------------------------------------------------------
AttributeError                            Traceback (most recent call last)
<ipython-input-31-1a0b21f056c1> in <module>()
     12 width = 0.35       # the width of the bars: can also be len(x) sequence
     13
---> 14 p1 = plt.bar(ind, menMeans, width, color='#d62728', yerr=menStd)
     15 p2 = plt.bar(ind, womenMeans, width,
     16              bottom=menMeans, yerr=womenStd)

/Applications/anaconda/lib/python3.6/site-packages/matplotlib/pyplot.py in bar(*args, **kwargs)
   2625                       mplDeprecation)
   2626     try:
-> 2627         ret = ax.bar(*args, **kwargs)
   2628     finally:
   2629         ax._hold = washold

/Applications/anaconda/lib/python3.6/site-packages/matplotlib/__init__.py in inner(ax, *args, **kwargs)
   1708                     warnings.warn(msg % (label_namer, func.__name__),
   1709                                   RuntimeWarning, stacklevel=2)
-> 1710             return func(ax, *args, **kwargs)
   1711         pre_doc = inner.__doc__
   1712         if pre_doc is None:

/Applications/anaconda/lib/python3.6/site-packages/matplotlib/axes/_axes.py in bar(self, *args, **kwargs)
   2112         # subtracted uniformly
   2113         if self.xaxis is not None:
-> 2114             x = self.convert_xunits(x)
   2115             width = self.convert_xunits(width)
   2116             if xerr is not None:

/Applications/anaconda/lib/python3.6/site-packages/matplotlib/artist.py in convert_xunits(self, x)
    189         if ax is None or ax.xaxis is None:
    190             return x
--> 191         return ax.xaxis.convert_units(x)
    192
    193     def convert_yunits(self, y):

/Applications/anaconda/lib/python3.6/site-packages/matplotlib/axis.py in convert_units(self, x)
   1489             return x
   1490
-> 1491         ret = self.converter.convert(x, self.units, self)
   1492         return ret
   1493

/Applications/anaconda/lib/python3.6/site-packages/matplotlib/category.py in convert(value, unit, axis)
     41         data as floats
     42         """
---> 43         vmap = dict(zip(axis.unit_data.seq, axis.unit_data.locs))
     44
     45         if isinstance(value, six.string_types):

AttributeError: 'NoneType' object has no attribute 'seq'
Matplotlib version
- Operating system: macOS 10.13.2
- Matplotlib version: 2.1.0
- Matplotlib backend (
print(matplotlib.get_backend())): module://ipykernel.pylab.backend_inline - Python version: 3.6.3 |Anaconda custom (x86_64)| (default, Oct 6 2017, 12:04:38)
[GCC 4.2.1 Compatible Clang 4.0.1 (tags/RELEASE_401/final)] - Jupyter version (if applicable):
jupyter 1.0.0 py36h598a6cc_0
jupyter_client 5.1.0 py36hf6c435f_0
jupyter_console 5.2.0 py36hccf5b1c_1
jupyter_core 4.3.0 py36h93810fe_0 - Other libraries:
numpy 1.12.1 py36_blas_openblas_201 [blas_openblas] conda-forge
(but the issue is reproduced even without using numpy. It's just that numpy is used in the matplotlib example reported)
Activity
story645 commentedon Dec 29, 2017
It's somehow hitting the categorical call chain, which that example isn't supposed to do. Can you please post the exact code you typed?
jklymak commentedon Dec 29, 2017
That example works on master and 2.1.0. Please find a self-contained example that causes your issue. Note that categorical support is still being overhauled.
lczyk commentedon Dec 30, 2017
This code causes virtually the same error (albeit this time the error occurs on line 4, not 14 - also in
plt.bar):Raab70 commentedon Dec 31, 2017
I was unable to reproduce w/2.1.0 matching versions as best I could:
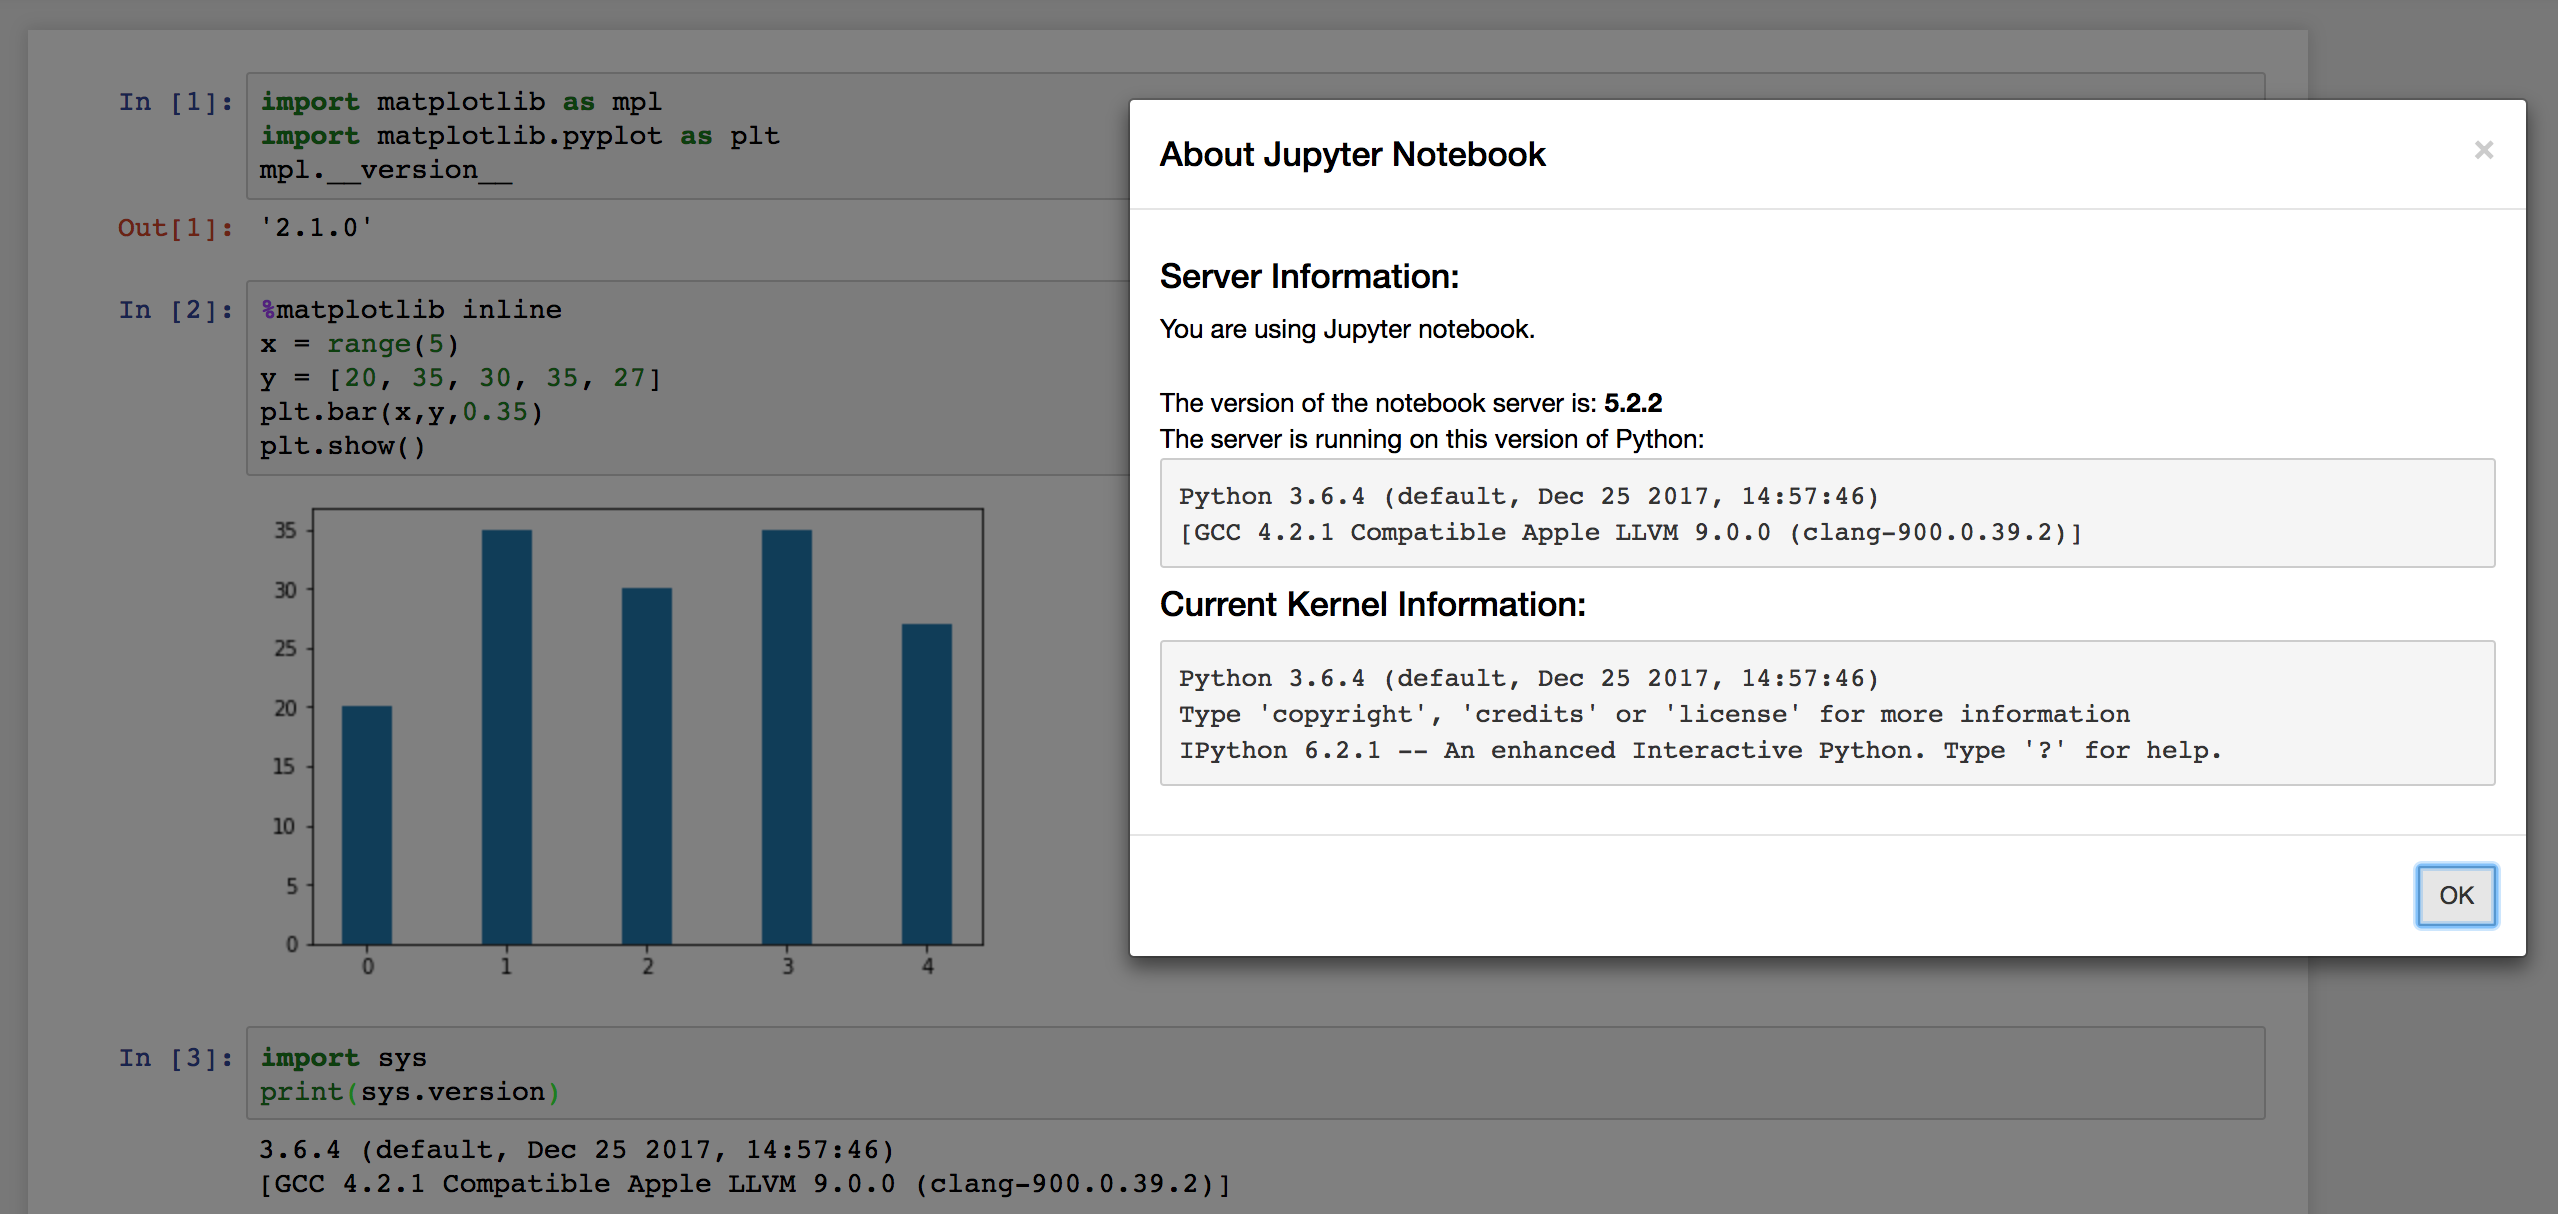
mac OS: 10.12.6
matplotlib: 2.1.0
python: 3.6.4
jupyter (1.0.0)
jupyter-client (5.1.0)
jupyter-console (5.2.0)
jupyter-core (4.4.0)
notebook (5.2.2)
mpl backend: module://ipykernel.pylab.backend_inline
jklymak commentedon Dec 31, 2017
Yes, that works on master as well. @MarcinKonowalczyk does the code work from the command line? Maybe something is wrong w/ Jupyter for you or you are having a bad interaction with a browser?
I'll leave open for now, but this doesn't seem to be a matplotlib bug.
lczyk commentedon Dec 31, 2017
I went to retry with x = [1,2,3,4,5] but in the meantime I've restarted the Jupyter kernel and the bug has gone away.
@jklymak You're right that it probably isn't a bug with matplotlib then. Sadly I don't know how to reproduce it now which means I also can't check whether it occurs though the command line. As far as I'm aware; close the issue. I find a way to reproduce the bug, I will come back to it (if nothing else then to ask where to report it to).