Repository navigation
Keras[torch] eager is ~9× slower than raw PyTorch on small models — per-call Python dispatch (root causes + fix series) #22561


Description

Keras[torch] eager is ~9× slower than raw PyTorch on small models — per-call Python dispatch (root causes + fix series)
On a small model, the torch kernels are not the bottleneck — Keras's per-call Python dispatch is. That tax hits both modes a torch deployment can run: eager execution pays it on every call, and torch.compile — the mode PyTorch steers production training and serving toward — trips over it and ends up worse than eager on master, not better. This issue tells both stories at equal weight.
- On CPU, cProfile attributes ~59% of tottime to dispatch/bookkeeping vs ~41% to the torch kernel frames it can see (see Where the time goes — this is a profiler-tottime split, not a wall-clock share, and cProfile amplifies Python-call cost).
- On GPU, the named kernels sped up 1.4×–16× (matmul most, layer_norm least); the Python dispatch time barely moves (1.09×).
- Result: on GPU the dispatch share of profiled time climbs to ~86%, simply because the kernels it's compared against got so much faster while the dispatch didn't shrink.
That is why Keras[torch] feels slow specifically on small models and short sequences — exactly the shapes used for per-token inference and unit-sized training steps, where every millisecond is Python, not math.
The clearest proof the tax is removable: when tracing folds the per-call Python away, Keras adds almost nothing. On the same CUDA box, Keras[jax] under jax.jit lands essentially on top of raw jitted JAX — generate-32 within ~4% (6.04 vs 5.82 ms), and the jitted Keras[jax] CNN forward is the single fastest cell in the whole 8-config matrix below. Same Keras code, same Python call machinery — once tracing folds the per-call dispatch out, the overhead is gone. Torch eager, which re-runs that Python on every single call, pays it in full: 8.6–9.8× over raw PyTorch eager. And torch.compile — the torch-side equivalent of "fold the Python away" — cannot fold it away on master, because Keras trips Dynamo into graph breaks; so compiled Keras[torch] is actually slower than eager until this series fixes the breaks.
I profiled where the time actually goes and split the fixes into a series of focused PRs, each output-equivalence-checked against master (bit-exact everywhere except one documented float32-rounding delta ≤ 1.7e-06 — see Results), each root cause tracked as its own sub-issue. 17 PRs are open: 13 root-cause PRs in a suggested merge order, plus a 4-PR chain that extends the call-binding fast path (#23288 → #23296 → #23300 → #23301, stacked on #23198). The series improves both deployment paths: eager speeds up steadily PR-by-PR, and three of the 13 (#23189, #23201, #23198) also carry the structural fixes that take torch.compile from a consistent loss to a consistent win — see Improvement by PR: eager vs compile and torch.compile: the realistic deployment path, fixed end-to-end. Four further exploratory PRs are closed after canonical benchmarks showed no macro-level effect (details below).
Along the way I also found a real correctness bug in master — see The device-compare bug.
Two things I'd love a maintainer's read on
1. Landing order.
The 13 root-cause PRs are ordered in a suggested no-conflict merge sequence (the row order of the per-PR table); the call-binding chain stacks linearly on #23198 and can land right after it. Does that shape work for review, or would you prefer a different grouping?
2. Where should torch-specific compute live?
Two PRs add a torch code path inside a shared, backend-independent layer class: #23185 (direct F.linear/einsum dispatch in Dense/EinsumDense) and #23186 (SDPA dispatch in MultiHeadAttention). Would you rather I dispatch that torch compute through a keras/src/backend/torch op instead of a guarded branch inside the layer?
This is the same concern raised on my earlier bundled attempt (#22660): "we don't want Torch specific code in backend independent classes." I'd rather settle the shape before review than mid-review.
How to read this issue
- Every recurring-cost root cause below is backed by a deterministic cProfile call count — same count on every machine, every run. That's the strongest evidence here, and by construction it is GPU-independent. (A handful of fixes are structural — they change which code path runs, so there is no counter to count; they're grouped separately and say so.)
- The graph-break counts that drive the
torch.compilestory are equally deterministic — atorch._dynamo.explaincensus, GPU-independent, reproduced identically across runs. - Wall-clock numbers (ms, ×) are noisier and machine-dependent, but every one is measured on the same box against a
masterbaseline and traced to a results file — never estimated. Every canonical claim uses a same-session paired baseline; the one place two sessions are composed (the cumulative chart's chain segment), the chart says so on its face. - Reproduces on a clean
masterwith two self-contained scripts. See Reproduce.
The symptom
Keras[torch] eager is ~9× slower than raw PyTorch eager on the same model.
Two models, unchanged across every measurement in this issue:
- CNN — 113,866 params, batch 4, 32×32×3 image.
- LLM — 2,105,344 params, 2-layer transformer, batch 4, sequence 64, 32-token greedy generate.
| Operation | raw PyTorch eager | Keras[torch] eager (master) |
Overhead |
|---|---|---|---|
| CNN forward | 0.134 ms | 1.204 ms | 8.97× |
| LLM forward | 0.397 ms | 3.409 ms | 8.59× |
| LLM generate-32 | 11.21 ms | 110.32 ms | 9.84× |
The full picture is 8 configs × 3 workloads — raw PyTorch, raw JAX, Keras[torch] and Keras[jax], each measured both eager and compiled/jitted, same session, same box. Measuring both modes is the point: a framework's real-world latency is whichever mode you actually deploy, and for torch that is increasingly torch.compile. The chart shows actual wall-clock time, not just ratios (log scale: the matrix spans 0.128 ms to 792 ms):

| Config | CNN forward | LLM forward | LLM generate-32 |
|---|---|---|---|
| raw PyTorch eager | 0.134 ms | 0.397 ms | 11.21 ms (2,854 tok/s) |
| raw PyTorch compile | 0.218 ms | 0.328 ms | 10.24 ms (3,124 tok/s) |
| raw JAX eager | 1.036 ms | 4.852 ms | 187.07 ms (171 tok/s) |
| raw JAX jit | 0.141 ms | 0.329 ms | 5.82 ms (5,495 tok/s) |
| Keras[torch] eager | 1.204 ms | 3.409 ms | 110.32 ms (290 tok/s) |
| Keras[torch] compile | 2.680 ms | 5.118 ms | 161.97 ms (198 tok/s) |
| Keras[jax] eager | 2.474 ms | 18.22 ms | 792.29 ms (40 tok/s) |
| Keras[jax] jit | 0.128 ms | 0.368 ms | 6.04 ms (5,296 tok/s) |
tok/s = 32 generated tokens ÷ median call latency. Each generate call produces 32 tokens for every one of the 4 sequences in the batch; this column counts one sequence's 32, i.e. a single-stream view.
What the matrix shows:
- The torch pair is the symptom. Keras[torch] eager pays 8.97× (CNN), 8.59× (LLM forward), 9.84× (generate-32) over raw PyTorch eager — the title's ~9×.
- The JAX pair under jit is the proof the tax is removable. Keras[jax] jitted lands within ~4% of raw JAX jitted on generate-32 (6.04 vs 5.82 ms) and within ~12% on LLM forward (0.368 vs 0.329 ms) — and the jitted Keras[jax] CNN forward (0.128 ms) is the fastest cell in the entire matrix, ahead of raw JAX jit (0.141 ms). Once tracing folds the per-call Python out, Keras adds roughly nothing. The overhead is the per-call dispatch, not Keras's math.
- Eager op-by-op is not how JAX is meant to run — jitted raw JAX is 7×–32× faster than eager raw JAX across these workloads, so the JAX columns to take seriously are the jitted ones. For completeness, the eager-vs-eager ratio: Keras[jax] eager is 2.4×–4.2× over raw JAX eager — same direction as the torch pair, smaller ratio. The slowest cell in the matrix is Keras[jax] eager generate-32 at 792 ms: unjitted eager JAX plus per-call Keras dispatch compounds worst of all.
- Compiling Keras[torch] on
mastermakes it slower (161.97 vs 110.32 ms generate-32) while compiling raw PyTorch helps — that is a Keras-side problem, and it is the one most deployments hit, since compiled is the mode you ship. Root-caused and fixed in the compile section.
The title's overhead figure comes from the fresh CUDA baselines above. The issue was originally filed at 2.5–4.8× from an MPS-on-Apple-Silicon report; full provenance and the then→now reconciliation are in the Appendix.
Where the time goes
Same LLM forward pass, profiled with cProfile, CPU vs GPU, 100 iterations, tottime in seconds:
| Operation | CPU (100 iters, tottime s) | GPU (100 iters, tottime s) | Speedup on GPU |
|---|---|---|---|
torch.einsum |
0.1234 | 0.0262 | 4.71× |
torch.add |
0.0439 | 0.0168 | 2.61× |
torch.matmul |
0.2259 | 0.0140 | 16.12× |
torch.layer_norm |
0.0141 | 0.0103 | 1.37× |
| Keras Python dispatch (getattr, isinstance, standardize_dtype, pytree, convert…) | 0.7455 | 0.6855 | 1.09× |
(The dispatch row is total profiled tottime minus the four kernel rows shown; it still contains a few smaller torch-side frames — gelu, scaled_dot_product_attention, torch's Python wrappers — which the share figures below move to the kernel side.)
The kernels scale down with a faster device (1.4×–16×, matmul benefiting most). The Python dispatch barely moves (1.09×). Summing every torch kernel-entry frame cProfile can see (the four rows above plus gelu, scaled_dot_product_attention, and torch's own wrapper frames): on CPU, kernel frames account for ~41% of profiled tottime and Keras-side dispatch/bookkeeping ~59%. On GPU the kernel frames collapse to ~14% while the dispatch stays nearly the same absolute size, so the dispatch share climbs to ~86% — the faster the device, the more completely Python dispatch dominates. (The "barely moves" claim is about absolute time; the share figures follow from it.)
Two stacked bars instead of one pie chart — the CPU and GPU compositions side by side, so the shift is a comparison, not a single static snapshot:
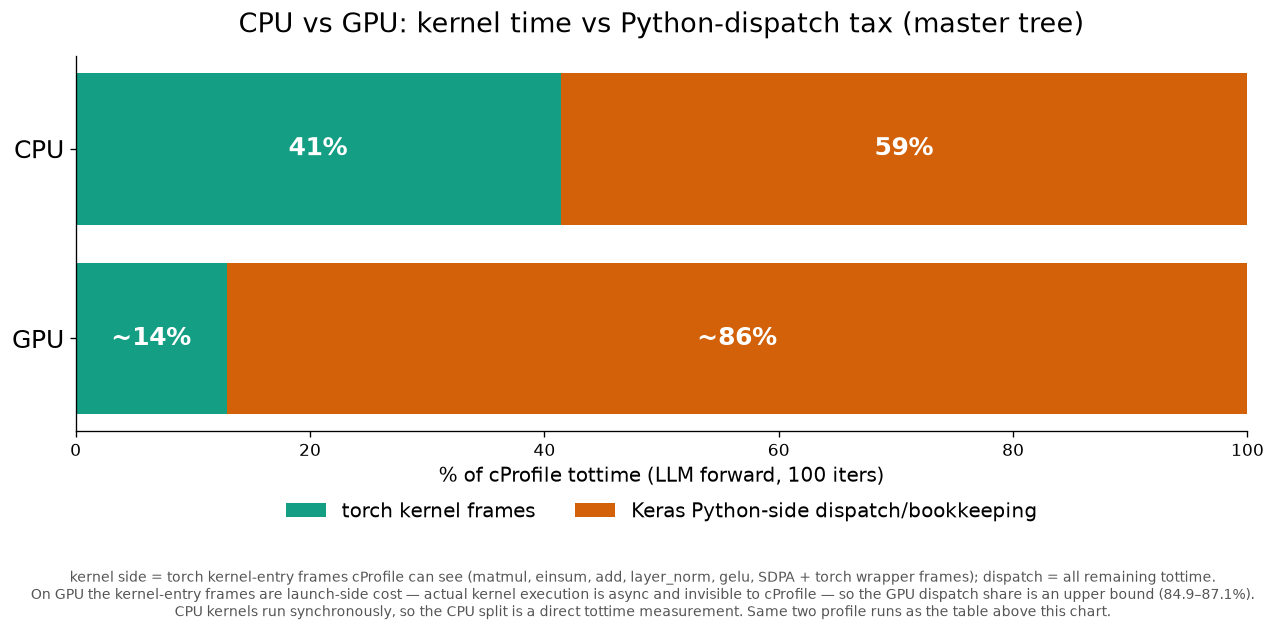
Read it like this: roughly 6 of every 10 profiled CPU milliseconds — and ~8.6 of every 10 GPU milliseconds — in this forward pass are Keras dispatch/bookkeeping, not torch kernel frames, and the dispatch share grows as the device gets faster. On GPU the split is an upper bound on the dispatch side, since cProfile can't see inside async kernel execution overlapping with Python.
(cProfile amplifies Python-call cost, so treat the exact percentage as directional — the deterministic call counts in the next section pin the mechanism precisely, independent of any profiler overhead.)
Improvement by PR: eager vs compile
The series has to be read in two modes side by side, because the two modes improve on completely different schedules — and both matter for deployment. This chart tracks cumulative speedup vs master, PR by PR in landing order, for both eager and torch.compile:

Eager (top panel) improves steadily and monotonically-ish. Cumulative speedup climbs from ~1.02–1.04× at #23182 to 1.36× at #23201 (canonical 8-pair paired-process runs), and the chain segment extends it to ~1.5–1.55× by #23301 — drawn dashed because it is the canonical #23201 anchor scaled by same-session deltas between chain positions (single-session medians, not the full paired protocol). There is no single hero PR — each one deletes a slice of per-call Python, and they compound. This is the per-PR eager table below, drawn as a line.
torch.compile (bottom panel, log scale) is a different shape entirely: flat-to-negative for most of the series, then a sharp flip. One thing to hold while reading it: the panel's timing basis is a model warmed by one eager call before compiling — the ordering that dodges Dynamo's recompile-limit trap (the compile section explains why that matters) — so points above 1.0× before #23201 are not wins a build-then-compile user would see. Read left to right:
- CNN forward and LLM generate-32 sit below the
master-eager baseline (net harmful) across nearly the whole series. Compiling them onmaster— or on most of the series — is slower than just running eager, because Keras trips Dynamo into graph breaks that the earlier PRs don't remove. Generate-32 under compile frequently doesn't even finish: the green "×" markers mark positions where it hit the harness's 180 s dynamo-timeout guard (stalled, no number recorded — plotted as an explicit break in the line, never interpolated through). - LLM forward turns positive at perf(torch): SDPA is_causal dispatch + bounded causal-mask cache in MultiHeadAttention #23186 — under the warmed ordering only. The SDPA dispatch fix removes the attention-path breaks (LLM 11 → 7), and with the model warmed the compiled forward beats eager from there on. A user who builds a model and immediately compiles it, though, still sees LLM forward ~1.9× slower than eager at every position until the folded fixes complete — the mid-series orange segment is a warmed-ordering result, not a cold-compile win.
- Everything flips sharply — and call-order-independently — at fix(torch): canonicalize nested dict key order in the torch tree implementation #23201: the pytree-leaf fastpath, which (together with the numpy-conversion and CallSpec fixes in fix(torch): remove the always-true device check in convert_to_tensor #23189 and perf(torch): eager CallSpec fast path skipping signature.bind in Layer.__call__ #23198) removes the last graph breaks and defuses the dynamo recompile-limit trap that was stalling generation. From here the win no longer depends on the warmed ordering, and it holds for every subsequent chain PR (perf(layers): extend CallSpec fast path to training=<bool> kwarg #23288 / fix(layers): don't drop call-context kwargs from the recorded Node when conversion is skipped #23296 / perf(backend): build tensor-attribute state keys with concatenation #23300 / perf(layers): open the layer name scope once per call, not twice #23301): on this chart's single-session basis generate-32 ends ~11–12× and CNN ~3.6× over master eager — the fresh build-then-compile pairing in the compile section puts the end state at 9.6× / 3.8×.
One honest caveat this chart encodes, spelled out so nobody over-reads it: the compile flip is not a property of the 13 eager PRs' code as first written — a deterministic break census on the series branches as first written (before the fold) shows 9 CNN / 7 LLM breaks persisting all the way through #23201. The flip comes from three small compile-specific structural fixes folded into #23189, #23201, and #23198 (matching the three break clusters), and it only becomes robust to call order once all three are in. The chart places each fix at the PR that now carries it, so the compile line turns at #23186 (LLM, warmed ordering only) and #23201 (CNN + generate, plus call-order robustness — the last of the three fold-carrying PRs by landing order). The full mechanism, the break-cluster→fix mapping, and the ablation that shows all three are required for 0/0 breaks are in the compile section.
Anatomy of one call
Every layer call walks the same pipeline, in order. Each box shows what happens, why it costs, and how often it fires — measured, deterministic, reproduces on any machine (counted against the 22 layer calls of one LLM forward pass on master):
flowchart TD
    A["model(x) — the graph walks to each layer in order"] --> B
    B["Set up pretty-error machinery<br/>A wrapper is allocated on EVERY call, used only if the call fails<br/>3.4 wrapper objects per layer call → #23183"] --> C
    C["Bind your args to the call signature<br/>A fresh CallSpec + inspect.Signature.bind runs every time<br/>1.0 per layer call — the single biggest cost → #23198"] --> D
    D["Re-validate the input spec<br/>The spec never changes between calls, but it's re-checked anyway<br/>14 re-checks per forward pass → #23184"] --> E
    E["Convert inputs to tensors<br/>8.0 standardize_dtype + 6.3 get_device calls per layer call;<br/>a device-compare bug forces a needless tensor.to() every time → #23182 #23189"] --> F
    F["Refresh layer bookkeeping<br/>built/called flags re-set, 28.4 thread-local lookups per layer call → #23200 #23188"] --> G
    G["layer.call() — the actual math<br/>uses einsum where F.linear / SDPA would be cheaper → #23185 #23186"] --> H
    H["Package the output<br/>A full pytree walk runs even for one plain tensor<br/>24.6 is_namedtuple_class calls per layer call → #23201"]
    style C fill:#a11,color:#fff
    style E fill:#a40,color:#fff
    style G fill:#161,color:#fff
None of these steps is expensive once. All of them run again on every layer, every call, every generated token — 22 layer calls per forward pass, ×32 for one 32-token generation.
The root causes
Each fix deletes one kind of repeated work.
The counts below come from verify_root_causes.py (in the repro gist), which runs one LLM forward pass and one generate-32 pass under cProfile and prints exact call counts. These are deterministic call counts, not timings — they reproduce identically regardless of machine or CPU load. On master, one LLM forward makes 22 layer calls; here's what each one triggers, grouped by category and ordered roughly by how much it accounts for:
Dispatch tax — the cost of routing every call through Python before any math happens:
| What fires | Per layer call | Per generate-32 | Fixed in |
|---|---|---|---|
Rebuilds the call signature from scratch every time. CallSpec + inspect.Signature.bind, 23 calls/forward |
1.0 | 736 | #23198 — skips binding entirely on simple calls and replaces inspect.Signature.bind with a pure-Python binder where binding is still needed |
| Allocates a pretty-error wrapper whether or not the call fails. 74 calls/forward | 3.4 | ~2,400 | #23183 |
fit()/evaluate()/predict() always call every layer with training= passed explicitly. #23198's skip-binding gate alone would exclude that shape, so the binding cost would survive on exactly the call shape training and batch inference use. Two chain PRs widen it: #23288 admits training=<bool> to the fast-path gate, and #23296 applies the same skip to the input-conversion walk one screen up (chain details below).
Dtype & conversion — the cost of re-checking things that already match:
| What fires | Per layer call | Per generate-32 | Fixed in |
|---|---|---|---|
Re-derives the dtype string on every tensor. standardize_dtype, 177 calls/forward |
8.0 | ~5,800 | #23182 |
Re-validates device/dtype on tensors that are already correct, including the device-compare bug. convert_to_tensor, 86 calls/forward |
3.9 | ~2,850 | #23189 |
State lookups — the cost of Python-level global-state plumbing:
| What fires | Per layer call | Per generate-32 | Fixed in |
|---|---|---|---|
Hits threading.local for global config on every layer. get_global_attribute, 624 calls/forward |
28.4 | ~20,000 | #23188 |
Validation — the cost of re-checking things that never change:
| What fires | Per layer call | Per generate-32 | Fixed in |
|---|---|---|---|
Re-checks input shape/dtype against a spec that never changes between calls. InputSpec.assert_input_compatibility, 14 calls/forward |
0.6 | 448 | #23184 |
Tree — the cost of generic pytree machinery on plain tensors:
| What fires | Per layer call | Per generate-32 | Fixed in |
|---|---|---|---|
Walks the full pytree structure to package one plain tensor. is_namedtuple_class, 541 calls/forward |
24.6 | ~17,500 | #23201 |
The isinstance total in one profiled forward pass: 2,592 calls (117.8 per layer call) → ~83,000 for one 32-token generation. That single number is the clearest illustration of "not expensive once, expensive 22×32 times."
Structural fixes — no per-call counter, by design
The remaining fixes change which code path runs, not how many times a Python-level counter fires — so there is no call count to show for them. Their evidence is each PR's own microbenchmark plus the stacked wall-clock results below:
What happens on master |
Fixed in |
|---|---|
Dense/EinsumDense route through generic einsum where F.linear is cheaper; MultiHeadAttention doesn't dispatch to scaled_dot_product_attention |
#23185, #23186 |
Conv layers do an NHWC→NCHW .contiguous() copy, then copy back, where one copy would do |
#23199 |
slice() coerces dynamic-shape indices to Python ints on the generate loop (and specializes dynamic dims under torch.export) |
#23190 |
Layer.__call__ re-assigns self.built/self._called on every call even when already set |
#23200 |
TorchTrainer takes a slower general path for loss and batch-size extraction on every training step |
#23187 |
The call-binding chain — four PRs stacked on #23198
Four PRs extend the call-machinery fast paths above to more call shapes. They form a linear chain on top of #23198 (#23288 → #23296 → #23300 → #23301); a deterministic dynamo census at the chain tip confirms the whole chain adds zero torch.compile graph breaks on top of #23198:
| PR | What it removes | Deterministic evidence |
|---|---|---|
| #23288 | Binding cost on calls that pass training=True/False — the shape fit()/evaluate()/predict() always use |
Fast-path gate admits training=<bool>: on a small functional model, Signature.bind calls per forward drop 14 → 3, matching the bare layer(x) case; graph-break census delta vs #23198: 0 |
| #23296 | The same training= exclusion in Layer.__call__'s input-conversion gate |
Same-shape skip; the zero-added-breaks censuses at #23288 and at the chain tip bracket it on the linear chain |
| #23300 | tree.map_structure/tree.flatten walks in the Layer.__call__ mask pipeline on single-tensor calls whose structure is already known |
Walks → 0 on the single-leaf-tensor shape (sub-issue #23294) |
| #23301 | The layer name scope opened twice per call, back to back (_maybe_build and the call itself) |
2 → 1 name_scope objects per already-built layer call (sub-issue #23290) |
A side benefit of splitting into small pieces instead of one bundle: it surfaced — and fixed — five latent bugs the earlier bundled attempt (#22660) would have shipped: a uint32→int64 dtype remap, a mixed-precision grad-dtype issue, an unbounded attention-mask cache, non-leaf autograd corruption, and a cross-device loss crash. Each now has its own regression test.
The device-compare bug
This is a real correctness bug on master, reproducible in a few lines. The names below match what the code is actually comparing, so the type mismatch is visible at a glance:
import torch
from keras.src.backend.torch.core import get_device  # KERAS_BACKEND=torch

keras_device = get_device()                  # 'cpu'                <- a plain str
tensor = torch.zeros(3)
tensor_device = tensor.device                # device(type='cpu')   <- a torch.device

needs_move = tensor_device != keras_device    # the check convert_to_tensor does
print(needs_move)   # True — ALWAYS, a torch.device never equals a str
needs_move is always True, no matter what device the tensor is actually on. That means every tensor pays a tensor.to() dispatch it doesn't need.
- On a single GPU, that's a wasted no-op copy on every call.
- On multi-GPU, the index-less
"cuda"string can mismatch a specificcuda:0device object — and actually move a tensor you didn't want moved.
Fixed in #23189 by comparing torch.device objects instead of a string and a device object.
Results
Every open PR carries complete, canonical isolated-vs-stacked benchmarks in its own description — interleaved paired-process A/B runs against a same-session master baseline, with verdicts gated against a same-session noise calibration. The tables below are canonical, not interim. All wall-clock numbers are measured on an NVIDIA RTX 4050 Laptop GPU (torch 2.13.0+cu130, jax 0.11.0, Keras master @ a2f8eac8).
This is the tax on every Keras[torch] user, every call, right now — here's what removing it is worth, in both eager and compiled.
Per-token throughput, in the unit you actually feel
Generate-32 expressed as tokens/second (single-stream basis, from the matrix above): raw PyTorch eager streams 2,854 tok/s; Keras[torch] on master streams 290 tok/s — a 9.84× gap. The 13 root-cause PRs stacked lift the eager number to ~391 tok/s (81.9 ms vs 111.1 ms in the same-session pairing below). Adding the three compile fixes and running compiled lifts it much further — ~2,590 tok/s (12.4 ms, single-stream basis, fresh build-then-compile measurement) — because compile can finally fold the dispatch away instead of stalling on it. The gap between raw PyTorch and Keras[torch] is pure Python dispatch, not GPU time — the GPU is available for that entire gap and idle.
Where the GPU actually waits
From the composition comparison above: on GPU, cProfile attributes dispatch/bookkeeping roughly 8.6 of every 10 profiled milliseconds of a forward pass (~86% of tottime), up from ~5.9 of 10 on CPU (~59%) — the share climbs on the faster device because the kernels shrank 1.4×–16× while the dispatch shrank only 1.09×. As stated above, the GPU figure is a cProfile-tottime upper bound (async kernel execution overlapping with Python is invisible to the profiler), not a literal wall-clock GPU-idle measurement — but it is consistent with the wall-clock evidence: on the same GPU, raw PyTorch runs this forward pass in 0.397 ms and Keras[torch] in 3.409 ms, so roughly 8.8 of every 10 wall-clock milliseconds are Keras-side overhead, not tensor math. That idle time compounds silently across every layer, every call, every token.
What the 13 root-cause PRs recover, stacked (eager)
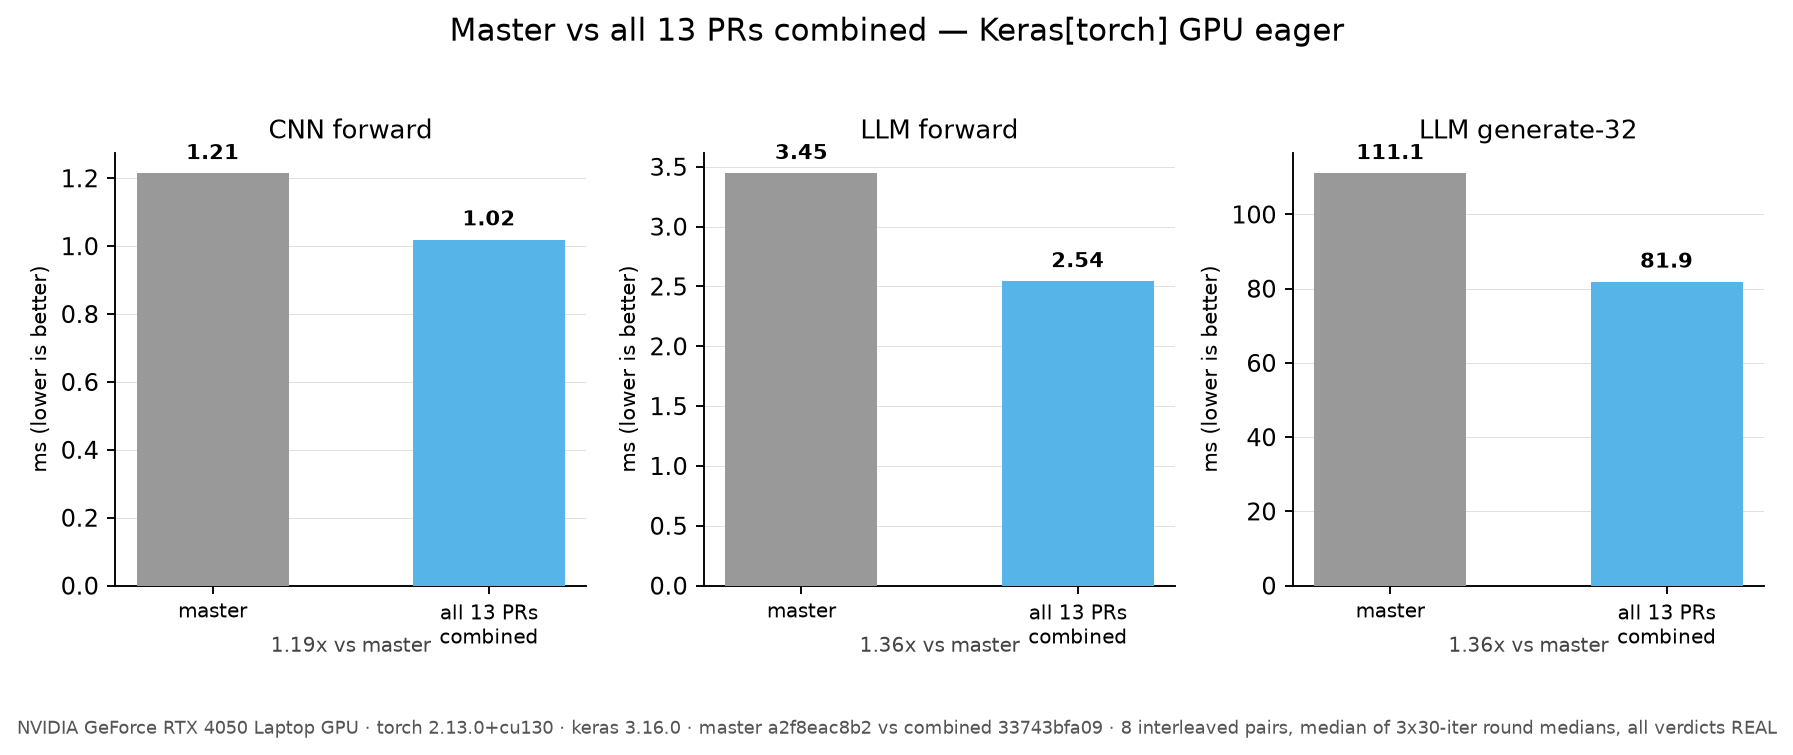
Chart, comparing master against all 13 stacked together — actual measured eager time, not just a ratio:
| Workload | master |
All 13 stacked | Speedup |
|---|---|---|---|
| CNN forward | 1.215 ms | 1.020 ms | 1.19× |
| LLM forward | 3.446 ms | 2.543 ms | 1.36× |
| LLM generate-32 | 111.113 ms | 81.868 ms | 1.36× |
(Source: the stacked benchmark in #23201's description — #23201 is last in the 13-PR sequence, so its "+parents" stacked comparison already is the full stack-vs-master measurement; reused directly rather than re-running an equivalent extra comparison. All three verdicts REAL, 8/8 pairs agreeing in direction, past their calibrated noise thresholds.)
Expressed as recovered time: using the matrix's raw-PyTorch anchor (11.21 ms generate-32) and this table's master (111.113 ms) / stacked (81.868 ms) numbers, the 13 PRs recover (111.113 − 81.868) / (111.113 − 11.213) ≈ 29.3% of the total gap between raw PyTorch and Keras[torch] on generate-32, running eager. (The anchor and the pair come from different harness scripts on the same box against the same master SHA, so treat the 29.3% as directionally accurate rather than exact to the last decimal.) The call-binding chain covers a further slice of the honest remainder — and, crucially, compiling the fixed stack closes far more of the gap than eager alone can. This is the well-understood, mechanically-verified part of the fix, not a complete one.
Equivalence, so "faster" never means "different": on every state tested, CNN forward is bit-exact vs master (max|Δ| = 0.0), LLM forward matches to float32 rounding (max|Δ| ≤ 1.7e-06, introduced by #23185's einsum→F.linear reformulation of Dense), and generate-32 token IDs are identical.
Per-PR data — the 13 root-cause PRs
Isolated-vs-stacked, GPU, verdicts gated against the noise calibration; "noise" is reported as noise, never rounded up into a claim. Every PR now carries per-PR compile coverage too, so the eager and compile schedules can be read together in one place. For the compile columns I use the deterministic torch._dynamo.explain graph-break count measured at every position — the same kind of machine-independent, run-stable evidence the root-cause counts rely on, and the direct cause of whether compile helps or hurts (fewer breaks → larger fused regions → compile can finally beat eager). The cumulative stack as first written — before the three compile fixes were folded in — is censused at each PR's landing position:
| PR | Sub-issue | LLM fwd (eager, stacked) | gen-32 (eager, stacked) | CNN breaks (compile) | LLM breaks (compile) |
|---|---|---|---|---|---|
| #23182 dtype fastpath | #23272 | — (isolated only — first PR, no parents) | — | 9 | 11 |
| #23183 lazy traceback | #23270 | within noise | 1.08× | 9 | 11 |
| #23184 input spec | #23275 | 1.11× | 1.09× | 9 | 11 |
| #23185 dense/einsum | #23276 | 1.19× | 1.18× | 9 | 11 |
| #23186 MHA/SDPA | #23277 | 1.21× | 1.21× | 9 | 7 ← LLM breaks drop (SDPA) |
| #23187 loss/trainer | #23282 | 1.25× | 1.26× | 9 | 7 |
| #23188 global state | #23273 | 1.21× | 1.22× | 9 | 7 |
| #23189 convert-to-tensor | #23274 | 1.20× | 1.20× | 9 | 7 |
| #23190 slice dynamic dims | #23278 | 1.20× | 1.18× | 9 | 7 |
| #23198 eager CallSpec | #23271 | 1.22× | 1.20× | 9 | 7 |
| #23199 conv contiguous | #23279 | 1.24× | 1.22× | 9 | 7 |
| #23200 built/called guard | #23280 | 1.33× | 1.32× | 9 | 7 |
| #23201 pytree leaf | #23281 | 1.36× | 1.36× | 9 | 7 |
Two schedules, one table — and they improve on completely different timelines. Eager (cols 3–4): each PR alone mostly lands within noise on the isolated (no-parents) comparison — expected, since no single PR moves 22%+ of wall time by itself; the signal shows up once parents stack, which is why every PR is measured both ways, and the numbers compound down the table because each row's "stacked" comparison includes every prior row's PR. The last row (#23201) is numerically the same measurement as the eager stacked table above. Compile (cols 5–6): the graph-break count is what governs compile latency, and reading it down the column is the honest story — the SDPA dispatch in #23186 is the only break-count mover in the series as originally written (LLM 11 → 7), and the series as first written never reaches zero breaks on its own (CNN stays 9, LLM stays 7 all the way through #23201). That is why compiling the plain series is still a loss for CNN and generate-32 — and, for a build-then-compile user, for LLM forward too: the wall-clock flip to a compile win requires three additional compile-specific structural fixes folded into #23189, #23198, and #23201, which drive the counts to 0/0. The measured wall-clock compile speedups those fixes unlock — up to 3.74× (CNN) / 4.14× (LLM fwd) / 6.72× (generate-32) vs eager — and the ablation proving all three fixes are required, are in the compile section. (Directional single-run compile wall-clock timing at the stack tail, one GPU process at a time, corroborates the break story — with the same caveat as everywhere else: those runs warm the model with one eager call before compiling, the ordering that dodges the recompile-limit trap. On that basis compiled LLM forward runs ~2.7×–3.3× faster than eager from #23189 onward — the earliest position wall-clock-timed — while CNN and generate-32 stay compile-hostile until the folded fixes land; a fresh build-then-compile run stays slower than eager at every one of those positions.) Full per-PR eager tables, charts, and data-quality notes (contamination discards, equivalence checks) are in each PR's own description, linked from its sub-issue.
The call-binding chain, measured (eager + compile)
The chain PRs carry their own isolated-and-stacked tables in their descriptions. On this box, eager: #23300 and #23301 each show REAL isolated wins on all three workloads (#23300: 1.20× CNN / 1.14× LLM forward / 1.16× generate; #23301: 1.19× / 1.17× / 1.16×), and #23296 on both LLM workloads (1.10× forward / 1.11× generate) — note a chain PR's own diff includes its chain predecessors, so these are measurements of the chain up to that link, not of one commit in isolation. #23288's primary evidence is deterministic: its gate widening covers the training= call shape, and the graph-break census at the chain tip shows the whole chain adds zero breaks on top of #23198. Compile: every chain PR preserves the flipped state at its landing position on the full series — compiled LLM forward stays 3.3×–3.6× faster than same-position eager across all four (#23288 3.6× / #23296 3.4× / #23300 3.4× / #23301 3.3×), generate-32 stays 6.5×–7.8× faster, and CNN 2.0×–2.4× (single-session medians at the zero-break state). The break censuses at #23288 and at the chain tip both show zero graph breaks added on top of #23198 (the two PRs in between are bracketed by those endpoints on the linear chain), so the chain extends the eager fast paths without disturbing the fixed compile path.
Explored and closed
Four exploratory PRs from a later root-cause pass are closed after canonical benchmarks showed no macro-level effect — eager within noise on this box and compile-neutral by break count:
- perf(backend): trim redundant work in Variable value/dtype accessors #23297 — trim redundant work in
Variablevalue/dtype accessors (sub-issue Variable value/dtype accessors redo derivations on every weight read #23293, closed with it) - perf(layers): skip _clear_losses recursion when no losses ever registered #23298 — skip
_clear_lossesrecursion when no losses were ever registered (sub-issue _clear_losses walks every sublayer even when no losses exist #23292 and duplicate _clear_losses recurses into every sublayer even when no losses exist #23295, closed with it) - perf(torch): dedupe double trainable_weights walk in train_step #23299 — dedupe the double
trainable_weightswalk intrain_step - perf(functional): stop re-deriving static per-call state #23302 — cache Functional-model static per-call state (sub-issue Functional models rebuild static call state on every forward pass #23291, closed with it)
Their mechanisms are real (each had a deterministic call-count reduction), but none cleared the macro noise floor, so they're closed to keep the open series limited to changes that earn their review cost.
Still open
Five PRs from this series are still open. Each is now linked to its own assigned sub-issue, per the PR policy in #23601:
| PR | Sub-issue | What it does |
|---|---|---|
| #23184 | #23275 | fast path for single-InputSpec assert_input_compatibility |
| #23336 | #23698 | memoize the result_type promotion-lattice walk |
| #23645 | #23649 | use channels_last memory format in torch pooling ops |
| #23646 | #23271 | bypass inspect.Signature.bind in CallSpec for single-input call() |
| #23647 | #23648 | drop id() and dict identity comparisons in torchtree_impl so tree.traverse is torch.compile-safe |
Two corrections to the tables above: #23198 (eager CallSpec) was closed unmerged — #23646 supersedes it against the same sub-issue #23271. And the result_type half of #23272 never landed; #23272 was closed once the standardize_dtype half merged, so #23698 was opened to track the remainder, which #23336 implements.
Sub-issue linkage
All root causes are tracked as GitHub sub-issues natively linked to this one. GraphQL confirms 19 total sub-issues natively linked: 5 open (#23271, #23275, #23648, #23649, #23698) and 14 closed (11 completed, 3 closed as not planned — #23273, #23276, #23291). The 19: 13 root-cause (#23270, #23271, #23272, #23273, #23274, #23275, #23276, #23277, #23278, #23279, #23280, #23281, #23282), 2 call-binding-chain (#23290 name-scope → #23301, #23294 single-tensor tree walks → #23300), 1 closed exploratory (#23291, Functional static call-state → closed #23302), and 3 opened later for the still-open PRs listed above (#23648 → #23647, #23649 → #23645, #23698 → #23336). The three other exploratory sub-issues touched by the closed PRs (#23292, #23293, #23295) were closed with their PRs and are not natively linked.
Why this matters now
Small-model, per-token inference is not an edge case — it's the common case for on-device and low-latency serving, where every call pays this tax and the GPU sits idle waiting for Python in between. And the mode PyTorch steers production serving and training toward — a compiled model, not an eager one — is exactly where master is worst: compile is slower than eager until this series fixes the graph breaks. Every Keras[torch] user hits this today, on every call, whether or not they've ever profiled it, and whether they deploy eager or compiled.
torch.compile: the realistic deployment path, fixed end-to-end (re: #21851)
Why this section carries equal weight with the eager story: compiled-mode is the deployment path PyTorch itself steers production training and serving toward, and the torch ecosystem keeps moving that way — so the eager-only ~9× story understates the series' real-world impact until it's read alongside this section. On master, compiling Keras[torch] doesn't just fail to help — it actively makes things slower than eager, which means the mode torch users are steered toward is the mode master handles worst. This series fixes that, and the fix is the larger half of the win.
Worth flagging first: the torch.compile "recompiles every step" / TrackedSet problems reported around #21851 were torch-2.8-era artifacts. They do not reproduce on torch 2.13 (the version tested here). On modern torch the compile story is specific, measurable — and now fully fixed within this series. Three stages, told in order:
1. On master, torch.compile makes Keras models slower — everywhere. The cause is Dynamo graph breaks in Keras itself: 9 breaks / 10 graphs on the CNN forward, 11 breaks / 12 graphs on the LLM forward (deterministic torch._dynamo.explain census, GPU-independent). The breaks come from three Keras-side clusters: numpy constants crossing the tensor-conversion boundary in the torch backend (keras/src/backend/torch/core.py), id()-keyed lambdas in the torch pytree registration (keras/src/tree/torchtree_impl.py), and inspect-based argument binding in the call machinery (keras/src/layers/layer.py). Measured wall-clock — fresh model wrapped directly in torch.compile(mode="default"), the ordinary "build it, compile it" workflow:
Workload (master) |
Eager | Compiled | Compile vs eager |
|---|---|---|---|
| CNN forward | 1.18 ms | 2.85 ms | 2.4× slower |
| LLM forward | 3.44 ms | 6.14 ms | 1.8× slower |
| LLM generate-32 | 119.1 ms | 195.0 ms | 1.6× slower |
2. The eager series alone improves compile only partially — and only conditionally. #23186's SDPA dispatch removes the attention-path breaks (LLM 11 → 7); it is the only break-count mover among the 13 as originally written. A deterministic census of the series branches as first written confirms this precisely: CNN stays at 9 breaks and LLM at 7 all the way through #23201. An earlier revision of this issue reported that with the full 13-PR stack the compiled LLM forward ran ~3× faster than eager. That measurement is reproducible — but it turned out to be call-order-dependent: it only holds if the model instance was already called eagerly at least once before compiling (the prior call leaves layers built, which happens to dodge Dynamo's recompile limit of 8). A user who builds a model and immediately compiles it still gets, on the full 13-PR stack: LLM forward ~1.9× slower than eager, CNN ~2.4× slower (none of the 13 touch its breaks), and generation 1.85× slower or stalling outright (one cross-check hit a 180 s timeout). The earlier ~3× compiled-forward claim was an artifact of that call order, and this issue no longer makes it.
3. Three structural fixes take the break count to zero and flip compile into a consistent, order-independent win. They are folded into three of the open PRs, matching the three break clusters: #23189 converts numpy scalars/arrays to tensors before they cross the conversion boundary, #23201 replaces the id()-keyed pytree lambdas with traceable named functions, and #23198 replaces inspect.Signature.bind with a pure-Python binder. An ablation on top of all 13 root-cause PRs stacked confirms all three are required, and in that order — none alone is sufficient:
| State (on all 13 root-cause PRs stacked) | CNN breaks | LLM breaks | CNN compile | LLM fwd compile | gen-32 compile |
|---|---|---|---|---|---|
| 13 stacked, no compile fix | 9 | 7 | 3.0× slower | 2.85× faster* | stall |
| + numpy-conversion fix (#23189) | 10 | 8 | 2.2× slower | 4.48× faster* | stall |
| + traceable-pytree fix (#23201) | 6 | 8 | 2.58× faster | 4.06× faster | 7.84× faster |
| + pure-Python binder (#23198) | 0 | 0 | 2.49× faster | 4.14× faster | 8.40× faster |
*All compile timings in this table use the ablation harness's warmed ordering (one eager call, then compile). The starred LLM-forward numbers on the top two rows are exactly the call-order-fragile measurement described in stage 2 and don't hold for a build-then-immediately-compile user; the fresh-compile cross-check that proves the win is order-independent exists at the 0/0 end state (final row — 4.14× fresh, matching warmed). Generate-32 under compile hit the harness's 180 s dynamo-timeout guard on both of the top two rows (the separate fresh-compile run on the plain 13-PR stack did complete — at 1.85× slower than eager, per stage 2). The break count is non-monotonic at the first fix (9→10 CNN) because the traceable fast path changes code shape before the tree-traversal and binder breaks are removed — only the full set reaches 0/0.
Together, on top of the series: CNN 9 → 0 breaks, LLM 7 → 0, outputs bit-identical, tests green, eager performance unchanged. Compiled vs the same tree's eager, at the full folded tip — measured fresh (build, compile immediately, no prior eager call), which is why the end-state magnitudes differ slightly from the warmed ablation rows above; these fresh numbers are the canonical ones:
| Workload (series + the three fixes) | Eager | Compiled | Compile vs eager |
|---|---|---|---|
| CNN forward | 1.17 ms | 0.313 ms | 3.74× faster (was 2.4× slower) |
| LLM forward | 2.40 ms | 0.580 ms | 4.14× faster — same result whether or not the model was called eagerly first; the call-order fragility is gone |
| LLM generate-32 | 83.0 ms | 12.4 ms | 6.72× faster — ~10,350 tokens/s vs ~1,540 eager (counting all 4×32 tokens the batched call generates); compiles cleanly in seconds, no stalls, no recompile-limit hits, no timeouts |
Net end-to-end vs today's master running eagerly: 3.8× (CNN) / 5.9× (LLM forward) / 9.6× (generate-32) for a user who applies the series and compiles. That is the number that matters for a real deployment — larger than the eager-only 1.19×–1.36×, precisely because compiled is the mode production torch deployments are steered toward.
Magnitude caveat: these are single-session medians from small benchmark models on a 6 GB laptop GPU. The ratios are Python-overhead-dominated and will compress on production-scale models. The qualitative result — the loss→win sign flip, the elimination of generation stalls, and the call-order independence — follows from removing every graph break (9→0 / 7→0), which is structural and expected to hold directionally. One scope note stated plainly: this series never targeted CNN's compile path in the eager PRs — CNN's compile win comes entirely from the folded structural fixes, so nobody should cite "compile now helps CNN" as an eager-series claim; it is a compile-fix claim.
Reproduce
Two self-contained scripts, no harness required: https://gist.github.com/pctablet505/8c30aa5ec58eeb2a6a4171ff6a319eab
git clone https://github.com/keras-team/keras && cd keras
curl -LO https://gist.githubusercontent.com/pctablet505/8c30aa5ec58eeb2a6a4171ff6a319eab/raw/verify_root_causes.py
curl -LO https://gist.githubusercontent.com/pctablet505/8c30aa5ec58eeb2a6a4171ff6a319eab/raw/profile_keras.py

# deterministic per-call proof (machine-independent call counts):
KERAS_BACKEND=torch PYTHONPATH=. python verify_root_causes.py

# where-the-time-goes composition profile — CPU run, then GPU run:
CUDA_VISIBLE_DEVICES="" KERAS_BACKEND=torch PYTHONPATH=. python profile_keras.py llm_fwd
KERAS_BACKEND=torch PYTHONPATH=. python profile_keras.py llm_fwd
Every wall-clock number in this issue comes from the paired-run benchmark harness; each PR's description carries the full tables and charts behind its own verdicts. Environment for every number above unless stated otherwise: torch 2.13.0+cu130, jax 0.11.0, NVIDIA RTX 4050 Laptop GPU, Keras master @ a2f8eac8.
Appendix: provenance & original MPS report
What changed since the original report. The issue was first filed from an MPS-on-Apple-Silicon benchmark (verbatim tables in the collapsible below), using an older bench.py raw-PyTorch/raw-JAX baseline. Every wall-clock number in the body above is a full redo on NVIDIA CUDA — where the PR series was developed and tested — with freshly written, idiomatic raw-PyTorch (nn.Module + F.scaled_dot_product_attention) and raw-JAX (jax.numpy/lax over an explicit param pytree) baselines, run both eager and compiled/jitted. Three things differ from the original report, all reported as measured:
| Claim | Original MPS report | Current CUDA measurement |
|---|---|---|
| Keras[torch] vs raw PyTorch overhead | 2.5–4.8× | ~8.6–9.8× (the fresh raw-PyTorch baseline is faster relative to Keras[torch], so the measured overhead is larger, not smaller) |
| Keras[jax] vs raw JAX | 0.29–0.59× eager ("faster than raw JAX") | 2.4–4.2× slower eager-vs-eager; essentially at parity under jit (the "beats raw JAX eager" framing does not hold on CUDA — but the jit-parity result is the stronger one) |
| torch.compile | MPS-era compile columns | A consistent loss on master; a consistent, call-order-independent win only after the three zero-break fixes folded into #23189/#23201/#23198 (see the compile section) |
Revision history. Filed with the MPS report → rewritten into a self-contained root-cause report → full benchmark redo on fresh CUDA baselines, eager and compiled → a further root-cause pass extended the series; four exploratory PRs later closed when canonical benchmarks showed no macro-level effect → torch.compile root-caused end-to-end; the three zero-break fixes folded into #23189/#23201/#23198 and the call-binding chain restacked on the reworked #23198 → the compile story rewritten to equal billing with eager, with per-PR compile coverage and a cumulative eager-vs-compile chart added. The eager-series headline effects were additionally replicated on a second, much newer GPU architecture (NVIDIA RTX PRO 6000 Blackwell) as a cross-architecture check — kernels shrink but the Python dispatch tax doesn't; the RTX 4050 numbers are the ones reported throughout, and the zero-break compile measurements are RTX 4050 single-session.
Original benchmark report (MPS, preserved verbatim)
The verbatim original MPS tables, unchanged, follow.
xychart-beta
    title "MPS overhead (×)"
    x-axis ["CNN eager", "CNN compile", "fwd eager", "fwd compile", "gen eager", "gen compile"]
    y-axis "×" 0 --> 5
    bar [3.93, 2.56, 3.17, 2.59, 4.77, 2.46]
Test Configuration
- Models: CNN (~114K params), LLM (~2.1M params, 2-layer transformer)
- Warmup Runs: 10 · Timed Runs: 50 · Batch Size: 4 · Sequence Length: 64 · Generate Length: 32 tokens
- Device: MPS (Apple Silicon)
- Reproduction Scripts:
bench.pyandrun_bench.shatpctablet505/keras@00952e9
Pure JAX
| Operation | Time |
|---|---|
| CNN eager | 3.09 ms |
| CNN compile | — |
| LLM forward eager | 13.37 ms |
| LLM generate-32 eager | 448.83 ms |
Keras[jax]
| Operation | Time |
|---|---|
| CNN eager | 0.90 ms |
| LLM forward eager | 7.84 ms |
| LLM generate-32 eager | 264.12 ms |
Raw PyTorch (MPS)
| Operation | Time |
|---|---|
| CNN eager | 0.52 ms |
| LLM forward eager | 1.22 ms |
| LLM generate-32 eager | 21.43 ms |
| LLM generate-32 compile | 64.83 ms |
Keras[torch] (MPS)
| Operation | Time |
|---|---|
| CNN eager | 2.03 ms |
| LLM forward eager | 3.86 ms |
| LLM generate-32 eager | 102.18 ms |
| LLM generate-32 compile | 159.29 ms |
This original report used torch's MPS backend on Apple Silicon; the GPU numbers throughout the rest of this issue are a full redo on NVIDIA CUDA, which is where the PR series was developed and tested. The MPS numbers are kept here for historical continuity only — not used anywhere else in this issue.
Activity
MarcosAsh commentedon Apr 2, 2026
Hi I made a pr solving this if there are any major gaps you think I missed please let me know. Thanks!
docs: clarify `loadEnv` merges `process.env` (keras-team#22561)
perf(backend): O(1) ALLOWED_DTYPES membership + cached standardize_dtype
perf(ops): inject traceback argument info on error only, not on every…
perf(layers): fast path for single-InputSpec assert_input_compatibility
perf(torch): direct F.linear/einsum dispatch in Dense and EinsumDense
perf(torch): SDPA is_causal dispatch + bounded causal-mask cache in M…
perf(torch): loss fast path + fast batch-size extraction in TorchTrainer
perf(torch): inline GLOBAL_STATE_TRACKER getattr in get_device()/dist…
86 remaining items
perf(torch): loss fast path + fast batch-size extraction in TorchTrainer
perf(layers): fast path for single-InputSpec assert_input_compatibility
perf(backend): O(1) ALLOWED_DTYPES membership + cached standardize_dtype
fix(torch): remove the always-true device check in convert_to_tensor (#…
perf(backend): O(1) ALLOWED_DTYPES membership and a fast path for can…
perf(torch): skip the flatten walk for batch-size extraction in Torch…
perf(layers): open the layer name scope once per call, not twice (#23301
fix(torch): slice() preserves dynamic dims (SymInt) under torch.export (
perf(layers): fast path for single-InputSpec assert_input_compatibili…
Add progress-update charts for issue keras-team#22561
pctablet505 commentedon Oct 18, 2026
Progress update: 15 PRs merged, re-measured on master (Jul 18 → Oct 15)
15 PRs from this series are now on master. I re-ran this issue's benchmark on master from Jul 18 (
a2f8eac8, the pin behind the numbers above), on master from Oct 15 (cc9de2b31), and on the commit just before and just after each merge. One idle GPU, the same torch and jax versions and the same two models throughout; only the Keras source changes.torch.compiletorch.compilegraph breaks per forward: CNN 9 → 0, LLM 11 → 0. Python function calls per LLM forward: PyTorch −23%, JAX −12%, TensorFlow −13%, NumPy −16%.torch.compilenow speeds Keras upIn July, compiling a Keras[torch] model made generate-32 1.47× slower than eager. Today the compiled model is 6.56× faster than eager Keras and takes 1.53× the time of plain compiled PyTorch (17.8× in July). Three merges did most of it, each by removing what kept
torch.compilefrom capturing the model or from reusing its compiled code. This is the inference side of #21851; training withfit(jit_compile=True)was not timed here.Each PR was timed on the commit just before and just after its merge, so each bar is that PR's own effect. The grey bar is the rest of master over the same three months, so the bars add up from the July value to today's.
Most of the series changed shared code (
Layer.__call__, op tracebacks, dtype handling, input checks), so the saving reaches every backend. These are exact cProfile counts; they repeat call for call on any machine.On JAX,
jax.jitruns the Python once at trace time, so jitted Keras[jax] was already close to plain JAX and stays there: 2.30 ms per generate-32 in July and 2.45 ms today against 2.22 ms for plain JAX, while the back-to-back check puts today 1.05× faster: unchanged within noise. Eager Keras[jax] goes 293 → 267 ms (1.10×; back-to-back check 1.08×).Still open
result_typememoization, result_type re-walks the promotion lattice on every call #23698) is approved; with it, eager generate-32 is 47.2 ms and NumPy makes 36% fewer Python calls per LLM forward than in July.Every PR, timed where it landed
Δ = just after the merge minus just before it; negative is better. Call deltas are exact, per LLM forward. Timing deltas are LLM generate-32 in ms; bold is a gain larger than run-to-run spread, parentheses are within it.
torch / JAX / TF / NumPy
gen-32
gen-32
torch.compilegraph break in the torch backend'sdot_product_attention. LLM graph breaks 11 → 0..to().Layer.__call__stops re-settingbuilt/_calledon every call.channels_lastcopy on torch conv inputs.slice()keeps dynamic dims undertorch.export.id()s, so compiled steps stop recompiling.channels_last.result_type.Every commit: the timelines, graph breaks and JAX
How this was measured
git archive: Jul 18 (a2f8eac8), the commit before and after each merge, Oct 15 (cc9de2b31), and Oct 15 with perf(backend): memoize result_type #23336 merged in.bench_frameworks.py, one process at a time, a GPU sync after every call. A commit's number is the median of 3 sweeps for Keras[torch] and 2 for Keras[jax]. A separate run timed July and today back to back in 3 rounds: 12.4× compiled and 1.20× eager, against 11.6× and 1.21× from the sweep. Run-to-run spread: 1–2% on generate-32.torch.compile(mode="default")around the model call (around one decode step for generate), compiled during warm-up;jax.jitovermodel.stateless_call.torch._dynamo.explain. Re-counting three commits reproduced every total exactly.Thanks to everyone who reviewed and merged these PRs.