Repository navigation
Remove image resizer#8098
Conversation


|
-1 because I like this feature. |
|
I don't have anything against this feature but it is causing significant issues and preventing us from implementing solutions that are trivial CSS fixes (e.g. something like this as a fix to #7701). Furthermore, the current jquery-ui Finally, the resizer (I think) is not widely used or even easily recognized. Its removal is not likely to disrupt the workflow of users. Actually, I would worry about excessively using the resizer to obtain larger images instead of doing it programmatically. |


|
We are going to merge all the things - remove resize, add simpler 'expand to original' from #8062, and scroll the output_subarea on overflow. |
This PR removes the image resizer for images. Removing the resizer helps a lot to solve the image overflow issue in #7701. Related PR: #8062. Before: 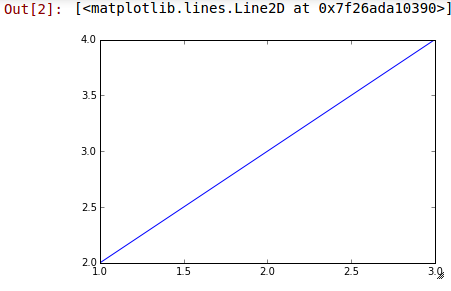 ...

|
Given that the resize handle is now gone, how do I make the image render larger? I am trying this and it does not seem to work: |
|
I think this is a question related to matplotlib. You can simply use: |
|
That seems to work. What then does |

|
that tells the default size for the figure when using inline figures with On Fri, Apr 24, 2015 at 9:53 AM, Alex Rothberg [email protected]
|
|
I have and |
|
you can try : import matplotlib but anyway the better way to do it is to learn the OO way of matplotlib. On Fri, Apr 24, 2015 at 10:02 AM, Alex Rothberg [email protected]
|
|
OO way? |
|
Object oriented. Create figure and axis references and manipute them. %matplotlib inline
import matplotlib.pyplot as plt
fig, ax = plt.subplots(1,1)
fig.set_figwidth(7)
fig.set_figheight(11)
ax.plot(range(10)) |
|
If I understood @cancan101 's question correctly, I think he wants to set the image size for all figures in the notebook. Otherwise, there is no need to be manipulating global variables. By the way, it is easier to do this: |

|
I really really miss the resizer!!! Changing the figsize is NOT an alternative to the resize handle. fig, ax = plt.subplots(figsize=(8,10))
ax.plot(range(10))
plt.show()
fig, ax = plt.subplots(figsize=(4,5))
ax.plot(range(10))
plt.show()The font size and line widths are the same, but the plot is twice as big. When I'm trying to make publication ready figures, it is nice so set the figsize that will put the text in proportion with the plot, and use the resize handle to get a closer look. Is there another solution to quickly and easily scale figures? Like actually scale everything? Or do I have to output to a file and view it from there now? |



This PR removes the image resizer for images. Removing the resizer helps a lot to solve the image overflow issue in #7701. Related PR: #8062.
Before:

After: