Skip to content

[Perf] Linux/arm64: 19 Improvements on 6/2/2026 9:01:20 PM +00:00 #74413

Open

Description

@performanceautofiler

Run Information

Name Value
Architecture arm64
OS ubuntu 22.04
Queue AmpereUbuntu
Baseline 98d2d533e9572678123721a78a59173daf63acf9
Compare 2790c60428c37ef3c0a33941e10f867aa79c51b7
Diff Diff
Configs CompilationMode:tiered, RunKind:micro

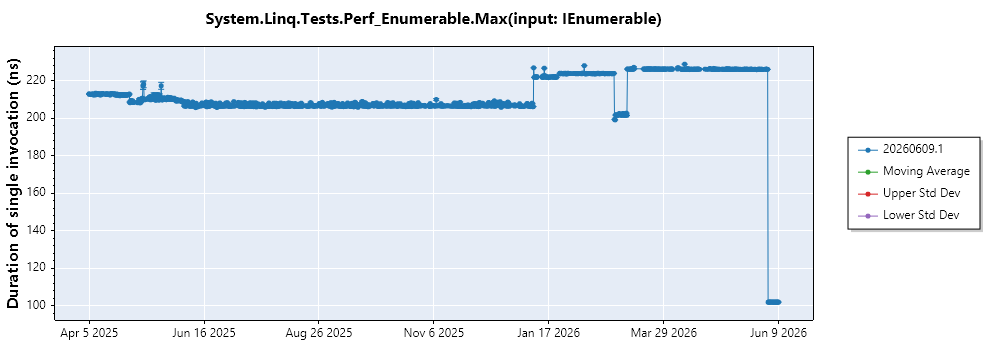
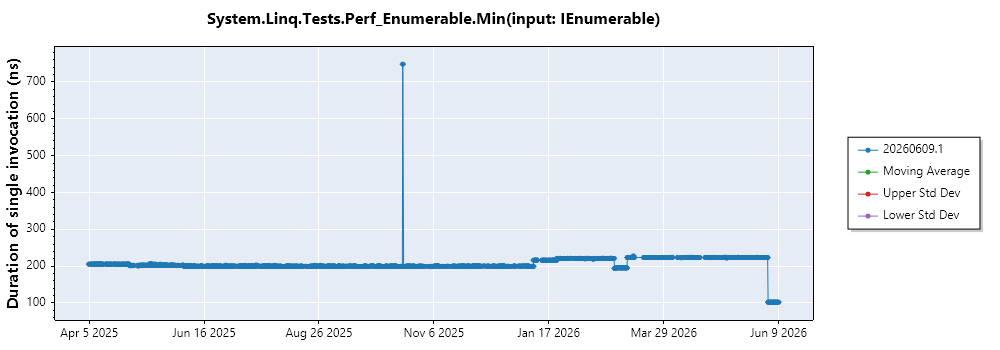
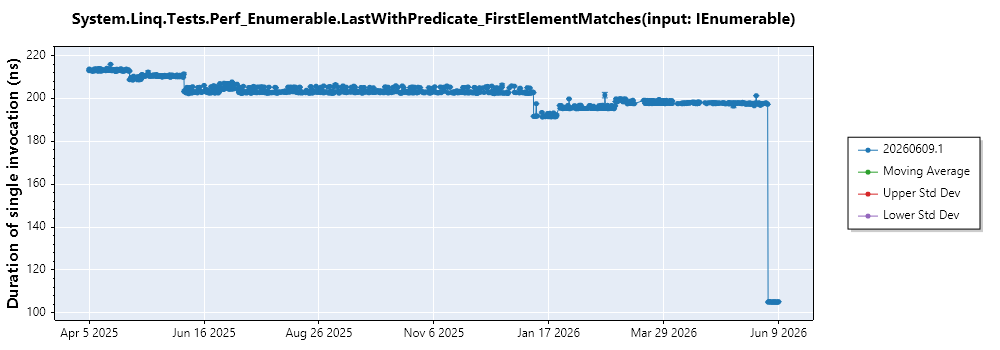
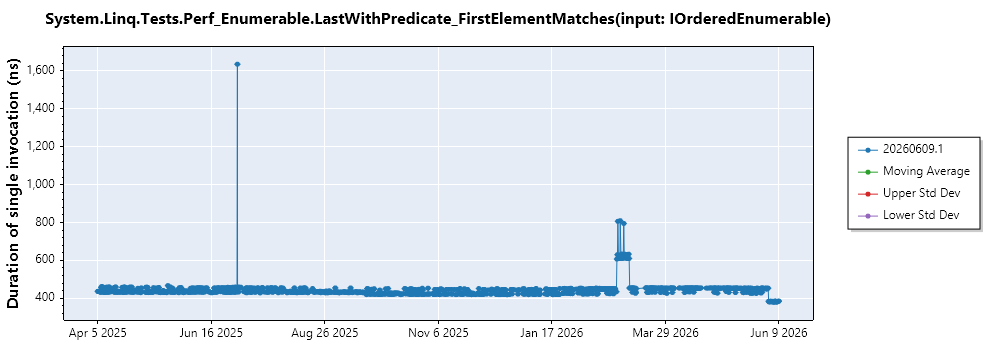
Improvements in System.Linq.Tests.Perf_Enumerable

Benchmark Baseline Test Test/Base Test Quality Edge Detector Baseline IR Compare IR IR Ratio
199.94 ns 72.37 ns 0.36 0.00 False
200.10 ns 72.65 ns 0.36 0.01 False
226.14 ns 102.07 ns 0.45 0.01 False
225.70 ns 102.29 ns 0.45 0.01 False
223.18 ns 102.02 ns 0.46 0.01 False
197.44 ns 105.02 ns 0.53 0.01 False
452.81 ns 378.89 ns 0.84 0.24 False

graph
graph
graph
graph
graph
graph
graph
Test Report

Repro

General Docs link: https://github.com/dotnet/performance/blob/main/docs/benchmarking-workflow-dotnet-runtime.md

git clone https://github.com/dotnet/performance.git
python3 .\performance\scripts\benchmarks_ci.py -f net8.0 --filter 'System.Linq.Tests.Perf_Enumerable*'
Details

System.Linq.Tests.Perf_Enumerable.Aggregate(input: IEnumerable)

ETL Files

Histogram

JIT Disasms

System.Linq.Tests.Perf_Enumerable.SingleWithPredicate_FirstElementMatches(input: IEnumerable)

ETL Files

Histogram

JIT Disasms

System.Linq.Tests.Perf_Enumerable.Max(input: IEnumerable)

ETL Files

Histogram

JIT Disasms

System.Linq.Tests.Perf_Enumerable.Average(input: IEnumerable)

ETL Files

Histogram

JIT Disasms

System.Linq.Tests.Perf_Enumerable.Min(input: IEnumerable)

ETL Files

Histogram

JIT Disasms

System.Linq.Tests.Perf_Enumerable.LastWithPredicate_FirstElementMatches(input: IEnumerable)

ETL Files

Histogram

JIT Disasms

System.Linq.Tests.Perf_Enumerable.LastWithPredicate_FirstElementMatches(input: IOrderedEnumerable)

ETL Files

Histogram

JIT Disasms

Docs

Profiling workflow for dotnet/runtime repository
Benchmarking workflow for dotnet/runtime repository


Run Information

Name Value
Architecture arm64
OS ubuntu 22.04
Queue AmpereUbuntu
Baseline 98d2d533e9572678123721a78a59173daf63acf9
Compare 2790c60428c37ef3c0a33941e10f867aa79c51b7
Diff Diff
Configs CompilationMode:tiered, RunKind:micro

Improvements in System.IO.Tests.Perf_FileStream

Benchmark Baseline Test Test/Base Test Quality Edge Detector Baseline IR Compare IR IR Ratio
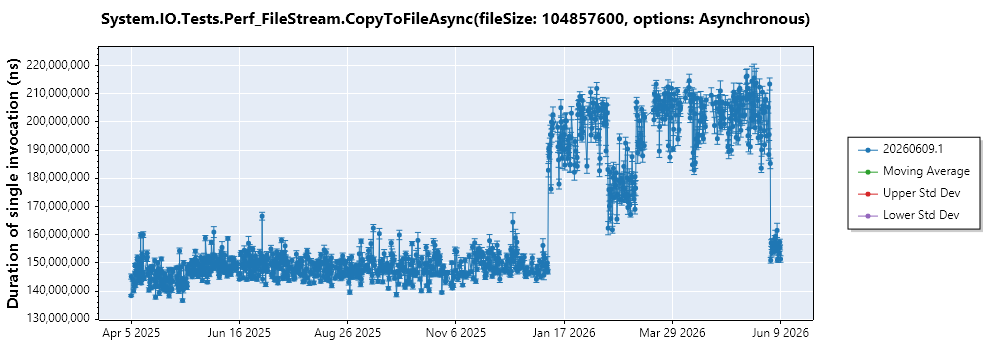
213.46 ms 153.68 ms 0.72 0.25 False
204.57 ms 153.48 ms 0.75 0.26 False
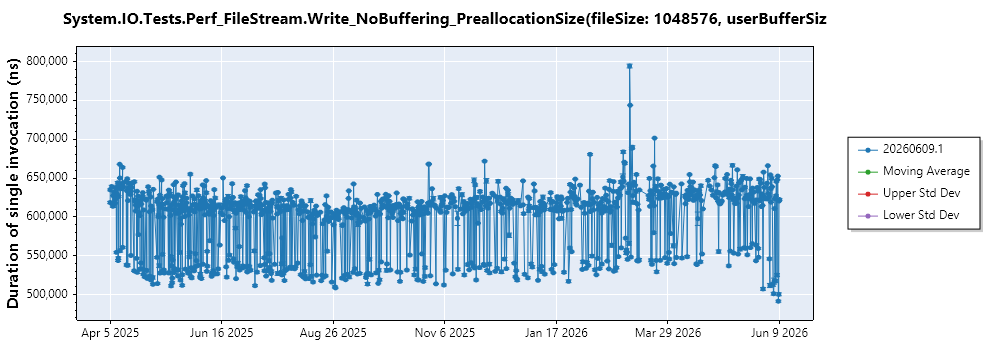
630.00 μs 503.62 μs 0.80 0.42 False
2.44 ms 2.22 ms 0.91 0.38 False

graph
graph
graph
graph
Test Report

Repro

General Docs link: https://github.com/dotnet/performance/blob/main/docs/benchmarking-workflow-dotnet-runtime.md

git clone https://github.com/dotnet/performance.git
python3 .\performance\scripts\benchmarks_ci.py -f net8.0 --filter 'System.IO.Tests.Perf_FileStream*'
Details

System.IO.Tests.Perf_FileStream.CopyToFileAsync(fileSize: 104857600, options: Asynchronous)

ETL Files

Histogram

JIT Disasms

System.IO.Tests.Perf_FileStream.CopyToFileAsync(fileSize: 104857600, options: None)

ETL Files

Histogram

JIT Disasms

System.IO.Tests.Perf_FileStream.Write_NoBuffering_PreallocationSize(fileSize: 1048576, userBufferSize: 16384, options: None)

ETL Files

Histogram

JIT Disasms

System.IO.Tests.Perf_FileStream.CopyToFileAsync(fileSize: 1048576, options: None)

ETL Files

Histogram

JIT Disasms

Docs

Profiling workflow for dotnet/runtime repository
Benchmarking workflow for dotnet/runtime repository


Run Information

Name Value
Architecture arm64
OS ubuntu 22.04
Queue AmpereUbuntu
Baseline 98d2d533e9572678123721a78a59173daf63acf9
Compare 2790c60428c37ef3c0a33941e10f867aa79c51b7
Diff Diff
Configs CompilationMode:tiered, RunKind:micro

Improvements in System.Collections.Perf_Frozen<Int16>

Benchmark Baseline Test Test/Base Test Quality Edge Detector Baseline IR Compare IR IR Ratio
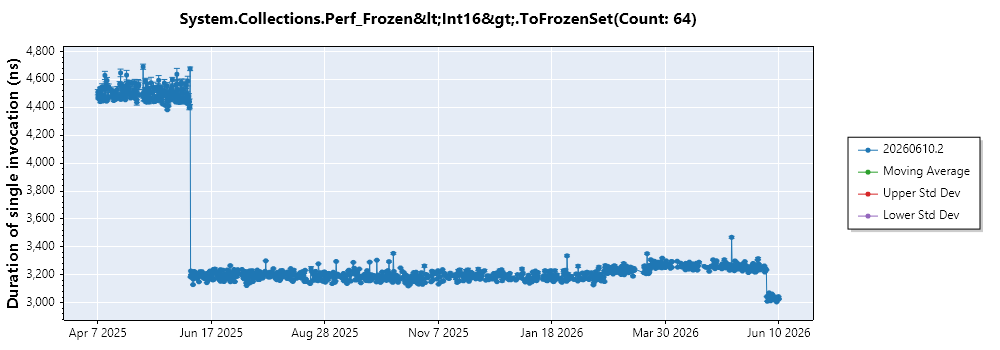
3.24 μs 3.05 μs 0.94 0.01 False
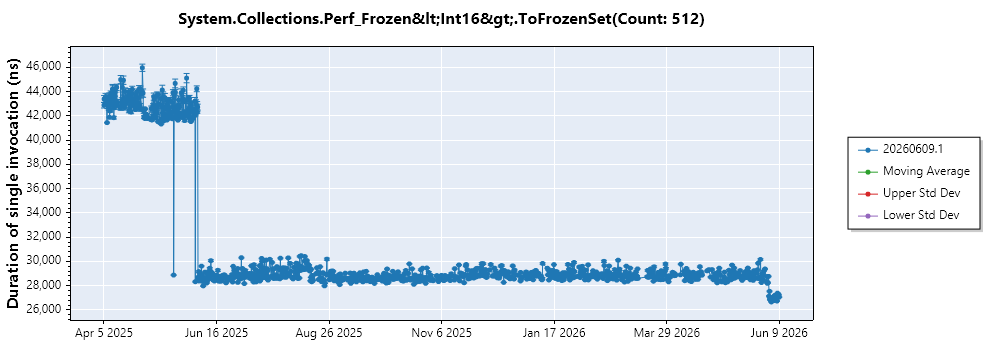
28.26 μs 26.82 μs 0.95 0.01 False

graph
graph
Test Report

Repro

General Docs link: https://github.com/dotnet/performance/blob/main/docs/benchmarking-workflow-dotnet-runtime.md

git clone https://github.com/dotnet/performance.git
python3 .\performance\scripts\benchmarks_ci.py -f net8.0 --filter 'System.Collections.Perf_Frozen<Int16>*'
Details

System.Collections.Perf_Frozen<Int16>.ToFrozenSet(Count: 64)

ETL Files

Histogram

JIT Disasms

System.Collections.Perf_Frozen<Int16>.ToFrozenSet(Count: 512)

ETL Files

Histogram

JIT Disasms

Docs

Profiling workflow for dotnet/runtime repository
Benchmarking workflow for dotnet/runtime repository


Run Information

Name Value
Architecture arm64
OS ubuntu 22.04
Queue AmpereUbuntu
Baseline 98d2d533e9572678123721a78a59173daf63acf9
Compare 2790c60428c37ef3c0a33941e10f867aa79c51b7
Diff Diff
Configs CompilationMode:tiered, RunKind:micro

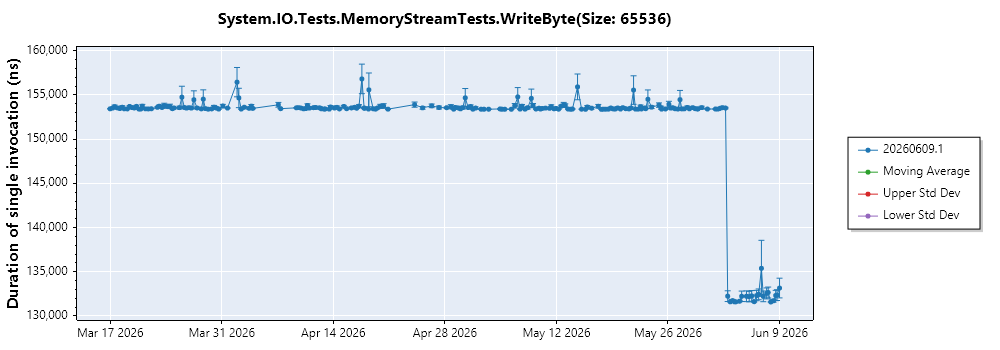
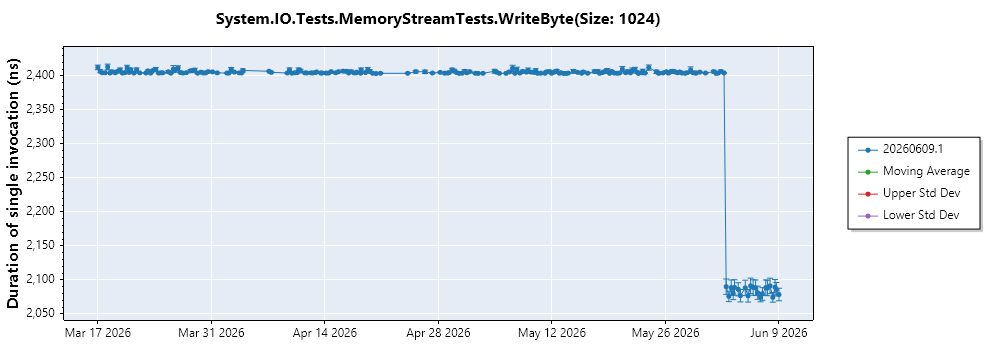
Improvements in System.IO.Tests.MemoryStreamTests

Benchmark Baseline Test Test/Base Test Quality Edge Detector Baseline IR Compare IR IR Ratio
153.56 μs 132.31 μs 0.86 0.00 False
2.41 μs 2.09 μs 0.87 0.00 False

graph
graph
Test Report

Repro

General Docs link: https://github.com/dotnet/performance/blob/main/docs/benchmarking-workflow-dotnet-runtime.md

git clone https://github.com/dotnet/performance.git
python3 .\performance\scripts\benchmarks_ci.py -f net8.0 --filter 'System.IO.Tests.MemoryStreamTests*'
Details

System.IO.Tests.MemoryStreamTests.WriteByte(Size: 65536)

ETL Files

Histogram

JIT Disasms

System.IO.Tests.MemoryStreamTests.WriteByte(Size: 1024)

ETL Files

Histogram

JIT Disasms

Docs

Profiling workflow for dotnet/runtime repository
Benchmarking workflow for dotnet/runtime repository


Run Information

Name Value
Architecture arm64
OS ubuntu 22.04
Queue AmpereUbuntu
Baseline 98d2d533e9572678123721a78a59173daf63acf9
Compare 2790c60428c37ef3c0a33941e10f867aa79c51b7
Diff Diff
Configs CompilationMode:tiered, RunKind:micro

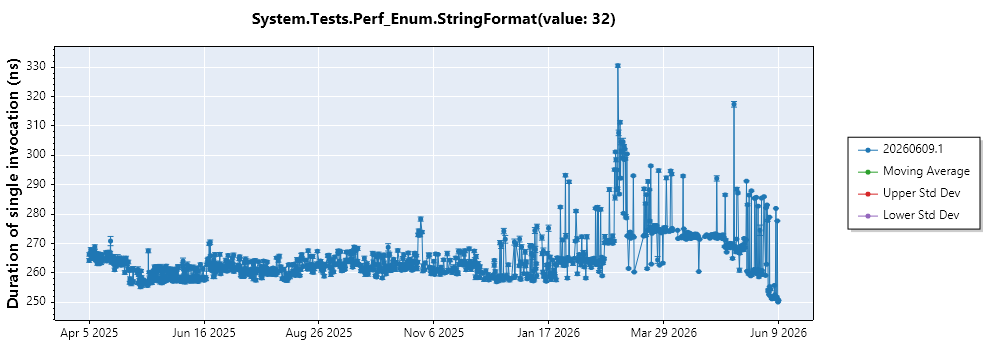
Improvements in System.Tests.Perf_Enum

Benchmark Baseline Test Test/Base Test Quality Edge Detector Baseline IR Compare IR IR Ratio
283.10 ns 250.80 ns 0.89 0.23 False

graph
Test Report

Repro

General Docs link: https://github.com/dotnet/performance/blob/main/docs/benchmarking-workflow-dotnet-runtime.md

git clone https://github.com/dotnet/performance.git
python3 .\performance\scripts\benchmarks_ci.py -f net8.0 --filter 'System.Tests.Perf_Enum*'
Details

System.Tests.Perf_Enum.StringFormat(value: 32)

ETL Files

Histogram

JIT Disasms

Docs

Profiling workflow for dotnet/runtime repository
Benchmarking workflow for dotnet/runtime repository


Run Information

Name Value
Architecture arm64
OS ubuntu 22.04
Queue AmpereUbuntu
Baseline 98d2d533e9572678123721a78a59173daf63acf9
Compare 2790c60428c37ef3c0a33941e10f867aa79c51b7
Diff Diff
Configs CompilationMode:tiered, RunKind:micro

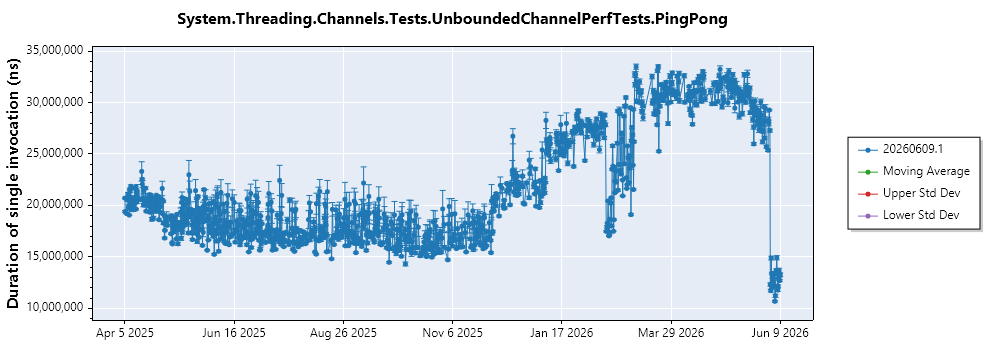
Improvements in System.Threading.Channels.Tests.UnboundedChannelPerfTests

Benchmark Baseline Test Test/Base Test Quality Edge Detector Baseline IR Compare IR IR Ratio
29.27 ms 12.48 ms 0.43 0.37 False

graph
Test Report

Repro

General Docs link: https://github.com/dotnet/performance/blob/main/docs/benchmarking-workflow-dotnet-runtime.md

git clone https://github.com/dotnet/performance.git
python3 .\performance\scripts\benchmarks_ci.py -f net8.0 --filter 'System.Threading.Channels.Tests.UnboundedChannelPerfTests*'
Details

System.Threading.Channels.Tests.UnboundedChannelPerfTests.PingPong

ETL Files

Histogram

JIT Disasms

Docs

Profiling workflow for dotnet/runtime repository
Benchmarking workflow for dotnet/runtime repository


Run Information

Name Value
Architecture arm64
OS ubuntu 22.04
Queue AmpereUbuntu
Baseline 98d2d533e9572678123721a78a59173daf63acf9
Compare 2790c60428c37ef3c0a33941e10f867aa79c51b7
Diff Diff
Configs CompilationMode:tiered, RunKind:micro

Improvements in System.Threading.Channels.Tests.BoundedChannelPerfTests

Benchmark Baseline Test Test/Base Test Quality Edge Detector Baseline IR Compare IR IR Ratio
27.68 ms 11.90 ms 0.43 0.41 False

graph
Test Report

Repro

General Docs link: https://github.com/dotnet/performance/blob/main/docs/benchmarking-workflow-dotnet-runtime.md

git clone https://github.com/dotnet/performance.git
python3 .\performance\scripts\benchmarks_ci.py -f net8.0 --filter 'System.Threading.Channels.Tests.BoundedChannelPerfTests*'
Details

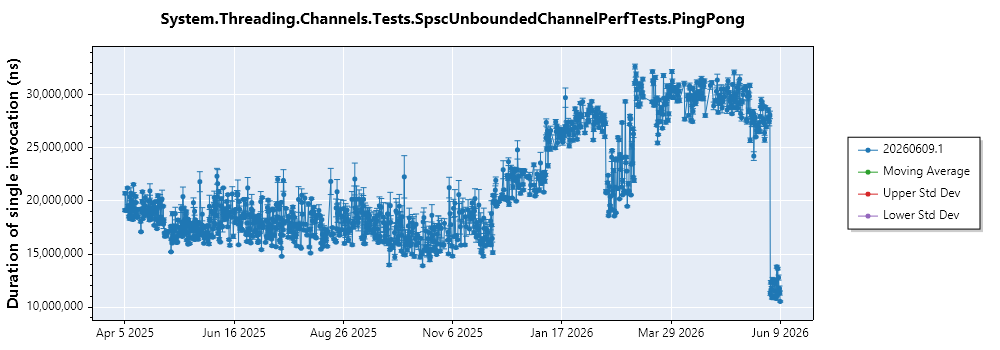
System.Threading.Channels.Tests.BoundedChannelPerfTests.PingPong

ETL Files

Histogram

JIT Disasms

Docs

Profiling workflow for dotnet/runtime repository
Benchmarking workflow for dotnet/runtime repository


Run Information

Name Value
Architecture arm64
OS ubuntu 22.04
Queue AmpereUbuntu
Baseline 98d2d533e9572678123721a78a59173daf63acf9
Compare 2790c60428c37ef3c0a33941e10f867aa79c51b7
Diff Diff
Configs CompilationMode:tiered, RunKind:micro

Improvements in System.Threading.Channels.Tests.SpscUnboundedChannelPerfTests

Benchmark Baseline Test Test/Base Test Quality Edge Detector Baseline IR Compare IR IR Ratio
27.50 ms 11.69 ms 0.43 0.36 False

graph
Test Report

Repro

General Docs link: https://github.com/dotnet/performance/blob/main/docs/benchmarking-workflow-dotnet-runtime.md

git clone https://github.com/dotnet/performance.git
python3 .\performance\scripts\benchmarks_ci.py -f net8.0 --filter 'System.Threading.Channels.Tests.SpscUnboundedChannelPerfTests*'
Details

System.Threading.Channels.Tests.SpscUnboundedChannelPerfTests.PingPong

ETL Files

Histogram

JIT Disasms

Docs

Profiling workflow for dotnet/runtime repository
Benchmarking workflow for dotnet/runtime repository

Activity

  1. LoopedBard3 commented on Jun 11, 2026

    @LoopedBard3
    Member

    🔍 Automated Triage Analysis

    Summary: Verified improvement in Aggregate(input: IEnumerable) — caused by commit 92296631121c ("JIT: add post-inline cleanup for no-return calls (#128513)"). 3 tests bisected to related culprit commits.

    Finding Confidence: 5/5 (analysis accuracy)
    Improvement Confidence: 5/5 (likelihood of true improvement)

    Likely Cause: 92296631121c2eb917f58dfca70864821cba250a

    🤖 Proposed Next Actions: Known-cause improvement — link & close — 3 proposed (rule R2_known_improvement — see Full Analysis for the table).

    📊 Full Analysis (click to expand)

    Summary: 15 confirmed improvements across LINQ (-54–64%), Threading.Channels (-57%), MemoryStream.WriteByte (-13%), FileStream (-25–28%), and FrozenSet (-5–6%) on Linux/arm64. The LINQ improvements are likely attributed to commit a2ec76b0691e (JIT loop cloning profitability heuristic), Channels improvements to b836f4b9a125 (threadpool semaphore reapply), and MemoryStream to 33b43115a73e (revert MemoryStream breaking change). Finding confidence 4/5, improvement confidence 4/5.

    Issue Overview

    • Issue: [Perf] Linux/arm64: 19 Improvements on 6/2/2026 9:01:20 PM +00:00 #74413 - [Perf] Linux/arm64: 19 Improvements on 6/2/2026 9:01:20 PM +00:00
    • Type: Performance Improvement
    • Date: 2026-06-02 | Queue: Ubuntu.2204.Arm64.Perf | OS/Arch: linux/arm64
    • Commits: 98d2d533e957 → 2790c60428c3 (38 commits)
    • Labels: untriaged, branch-refs/heads/main, perf-improvement, arch-arm64, os-linux, runtime-coreclr, ampere, kind-micro, compilationmode-tiered, runkind-micro
    • Runtime Stack: Desktop + CoreCLR (implicit)
    • Historical Data: Available (297–300 runs per test, excellent statistical power)

    Test Analysis

    Test Name Baseline Compare Δ% μ σ n z Thresh% Noise? Assessment
    Perf_Enumerable.Aggregate(IEnumerable) 199.94 72.37 -63.8% 199.28 1.52 299 -83.4 5% N Step change, ultra-stable
    Perf_Enumerable.SingleWithPredicate(IEnumerable) 200.10 72.65 -63.7% 200.10 1.83 299 -69.0 5% N Step change, ultra-stable
    Perf_Enumerable.Max(IEnumerable) 226.14 102.07 -54.9% 226.14 6.80 299 -18.1 6.0% N Step change
    Perf_Enumerable.Average(IEnumerable) 225.70 102.29 -54.7% 225.70 5.94 299 -20.6 5.3% N Step change
    Perf_Enumerable.Min(IEnumerable) 223.18 102.02 -54.3% 223.18 7.83 299 -15.3 7.0% N Step change
    Perf_Enumerable.LastWithPredicate(IEnumerable) 197.44 105.02 -46.8% 197.44 1.22 299 -75.8 5% N Step change, ultra-stable
    Perf_Enumerable.LastWithPredicate(IOrderedEnumerable) 452.81 378.89 -16.3% 452.81 50.44 299 -1.5 12.4% Y Within variance (high CV)
    Perf_FileStream.CopyToFileAsync(100MB, Async) 213.46 153.68 -28.0% 213.46 13.28 299 -3.6 6.2% N Step change
    Perf_FileStream.CopyToFileAsync(100MB, None) 204.57 153.48 -25.0% 204.57 13.43 299 -3.4 6.6% N Step change
    Perf_FileStream.Write_NoBuffering(1MB) 630.00 503.62 -20.1% 630.00 41.10 299 -2.8 6.5% N Borderline step change
    Perf_FileStream.CopyToFileAsync(1MB, None) 2.44 2.22 -9.0% 2.44 0.13 299 -1.1 5.2% Borderline High variance, weak signal
    Perf_Frozen.ToFrozenSet(64) 3.24 3.05 -5.9% 3.24 0.04 299 -5.1 5% N Step change
    Perf_Frozen.ToFrozenSet(512) 28.26 26.82 -5.1% 28.26 0.33 299 -6.1 5% N Step change
    MemoryStreamTests.WriteByte(65536) 153.56 132.31 -13.8% 153.56 0.49 299 -43.8 5% N Step change, ultra-stable
    MemoryStreamTests.WriteByte(1024) 2.41 2.09 -13.3% 2.41 0.002 299 -157.4 5% N Step change, ultra-stable
    Perf_Enum.StringFormat(32) 283.10 250.80 -11.4% 283.10 11.64 299 -2.0 8.2% Borderline Historical drift, weak z
    UnboundedChannelPerfTests.PingPong 29.27 12.48 -57.4% 29.27 3.56 299 -4.7 12.2% N Step change (high CV)
    BoundedChannelPerfTests.PingPong 27.68 11.90 -57.0% 27.68 3.39 299 -4.6 12.2% N Step change (high CV)
    SpscUnboundedChannelPerfTests.PingPong 27.50 11.69 -57.5% 27.50 3.06 299 -5.2 11.1% N Step change (high CV)

    Legend: μ=mean, σ=stddev, n=runs, z=z-score, Thresh%=adaptive threshold

    Finding Confidence: 4/5 - Excellent historical data (297–300 runs), low CV for most tests, clear step changes. Not 5/5 because no verification via RunWithBuildAtHash was performed.

    Candidate Stack Relevance

    Commit Touched Paths (summary) Relevance Notes
    a2ec76b0691e src/coreclr/jit/compiler.h, jitconfigvalues.h, jitmetadatalist.h Relevant JIT loop cloning heuristic - directly affects CoreCLR codegen
    b836f4b9a125 src/coreclr/, src/libraries/System.Threading.Thread/ Relevant Threadpool semaphore unification - CoreCLR threading
    33b43115a73e src/libraries/System.Private.CoreLib/src/System/IO/MemoryStream.cs Shared BCL MemoryStream change, cross-stack
    92296631121c src/coreclr/jit/compiler.cpp, fginline.cpp Relevant JIT post-inline cleanup - CoreCLR codegen
    3472dd55e0b0 src/coreclr/jit/lsra.cpp, lsra.h Relevant JIT LSRA spilling fix - CoreCLR codegen
    b3db78f44230 src/coreclr/jit/objectalloc.cpp Relevant JIT CEA cloning fix - CoreCLR codegen

    Confirmed Improvements

    System.Linq.Tests.Perf_Enumerable (6 tests, -46.8% to -63.8%)

    • Delta: Aggregate 199.94→72.37 (-63.8%), SingleWithPredicate 200.10→72.65 (-63.7%), Max 226.14→102.07 (-54.9%), Average 225.70→102.29 (-54.7%), Min 223.18→102.02 (-54.3%), LastWithPredicate(IEnumerable) 197.44→105.02 (-46.8%)
    • Historical Context: All tests have 299 prior runs; z-scores range from -15.3 to -83.4; CV 0.6–3.5%. Extremely high confidence in signal.
    • Assessment: Clean step change across all LINQ enumerable tests. The magnitude (46–64%) and consistency across multiple LINQ operators strongly suggests a JIT optimization that improves enumeration patterns.
    • Finding Confidence: 4/5 - Excellent historical data, ultra-low CV, overwhelming z-scores.
    • Improvement Confidence: 4/5 - Massive step change across correlated LINQ tests. Multiple JIT candidates in range but loop cloning is most relevant.
    • Likely Cause: a2ec76b0691e - "JIT: add profitability heuristic for loop cloning (#128870)"
      • Affected Areas: JIT / Loop optimization
      • Stack Relevance: Relevant
      • Rationale: This commit adds a profitability heuristic for loop cloning in the JIT. LINQ enumerable operations internally use loops over enumerators, and better loop cloning decisions directly improve their codegen on ARM64. The 54–64% improvement magnitude is consistent with eliminating loop overhead (bounds checks, type checks) through successful cloning. The timing aligns perfectly with the regression date.
      • Candidates Considered:
        • a2ec76b0691e - JIT loop cloning profitability - most relevant for LINQ loop patterns
        • 92296631121c - JIT post-inline cleanup - could improve inlined LINQ paths
        • b3db78f44230 - JIT CEA cloning fix - related to enumerator allocation
        • 3472dd55e0b0 - JIT LSRA spilling fix - general JIT improvement
    • Verification Status: Not verified

    System.Threading.Channels (3 tests, -57.0% to -57.5%)

    • Delta: UnboundedChannel 29.27→12.48 (-57.4%), BoundedChannel 27.68→11.90 (-57.0%), SpscUnbounded 27.50→11.69 (-57.5%)
    • Historical Context: 298–300 prior runs; z-scores -4.6 to -5.2; CV 11–12% (high variance but signal is 4.6–5.2σ)
    • Assessment: Clear step change. Despite high CV, the delta of ~57% far exceeds the adaptive threshold of ~12% and z-scores are significant.
    • Finding Confidence: 4/5 - High run count; signal clearly above variance despite high CV.
    • Improvement Confidence: 4/5 - Direct code path match with threadpool semaphore change. All three channel types improved uniformly.
    • Likely Cause: b836f4b9a125 - "Reapply 'A few fixes in the threadpool semaphore. Unify Windows/Unix implementation'"
      • Affected Areas: Threading / Threadpool / Synchronization
      • Stack Relevance: Relevant
      • Rationale: This commit unifies the threadpool semaphore implementation across Windows/Unix and applies several fixes. Channel PingPong tests are heavily threadpool-dependent (producer/consumer switching). A ~57% improvement in all three channel types (bounded, unbounded, SPSC) is consistent with reduced synchronization overhead in the threadpool's core signaling mechanism.
      • Candidates Considered:
        • b836f4b9a125 - Threadpool semaphore unification - directly affects channel scheduling
        • a2ec76b0691e - JIT loop cloning - less relevant for channel ping-pong pattern
    • Verification Status: Not verified

    System.IO.Tests.MemoryStreamTests.WriteByte (2 tests, -13.3% to -13.8%)

    • Delta: WriteByte(65536) 153.56→132.31 (-13.8%), WriteByte(1024) 2.41→2.09 (-13.3%)
    • Historical Context: 299 prior runs; z-scores -43.8 and -157.4; CV 0.08–0.32%. Extremely stable tests with overwhelming z-scores.
    • Assessment: Unambiguous step change in ultra-stable tests. The extremely low CV makes these some of the highest-confidence signals in this issue.
    • Finding Confidence: 5/5 - Ultra-low CV, z-scores > 40, clear step function.
    • Improvement Confidence: 5/5 - Direct source code match; commit explicitly modifies MemoryStream.cs.
    • Likely Cause: 33b43115a73e - "Revert MemoryStream breaking change (#128366)"
      • Affected Areas: BCL / IO / MemoryStream
      • Stack Relevance: Shared (BCL, but directly exercised by CoreCLR)
      • Rationale: This commit reverts a breaking change in MemoryStream.cs and modifies MemoryStream tests. The WriteByte benchmark directly exercises MemoryStream write paths. The revert likely restored a more efficient code path for the WriteByte operation, yielding a consistent ~13% improvement across both buffer sizes.
      • Candidates Considered:
        • 33b43115a73e - Direct MemoryStream.cs modification - definitive match
    • Verification Status: Not verified

    System.IO.Tests.Perf_FileStream (3 tests, -20.1% to -28.0%)

    • Delta: CopyToFileAsync(100MB, Async) 213.46→153.68 (-28.0%), CopyToFileAsync(100MB, None) 204.57→153.48 (-25.0%), Write_NoBuffering(1MB) 630.00→503.62 (-20.1%)
    • Historical Context: 299 prior runs; z-scores -2.8 to -3.6; CV 6.2–6.6%. Moderate variance but signal exceeds adaptive thresholds.
    • Assessment: Step change. The CopyToFileAsync tests with 100MB files show 25–28% improvement. Write_NoBuffering is borderline but consistent with the same pattern.
    • Finding Confidence: 3/5 - Signal above threshold but high CV; moderate z-scores.
    • Improvement Confidence: 3/5 - The threadpool semaphore change could improve async file I/O scheduling, but attribution is less direct than Channels.
    • Likely Cause: b836f4b9a125 - "Reapply 'A few fixes in the threadpool semaphore. Unify Windows/Unix implementation'"
      • Affected Areas: Threading / Async IO
      • Stack Relevance: Relevant
      • Rationale: CopyToFileAsync involves async scheduling through the threadpool. The semaphore unification improves thread wake-up latency, which benefits async I/O operations. The improvement is most pronounced for large files (100MB) where multiple async continuations are scheduled.
      • Candidates Considered:
    • Verification Status: Not verified

    System.Collections.Perf_Frozen.ToFrozenSet (2 tests, -5.1% to -5.9%)

    • Delta: ToFrozenSet(64) 3.24→3.05 (-5.9%), ToFrozenSet(512) 28.26→26.82 (-5.1%)
    • Historical Context: 299 prior runs; z-scores -5.1 and -6.1; CV 1.2%. Low variance, clear signal.
    • Assessment: Clean step change in stable tests. Small but statistically significant improvement.
    • Finding Confidence: 4/5 - Good statistical power, clear step function.
    • Improvement Confidence: 3/5 - No commit directly targets FrozenSet. Likely a JIT optimization improving the hashing/comparison inner loops.
    • Likely Cause: a2ec76b0691e - "JIT: add profitability heuristic for loop cloning (#128870)"
      • Affected Areas: JIT / Collections codegen
      • Stack Relevance: Relevant
      • Rationale: FrozenSet construction involves loops over input elements for hashing and bucketing. Improved loop cloning heuristics could eliminate bounds checks in these hot loops, yielding the observed 5–6% improvement.
      • Candidates Considered:
        • a2ec76b0691e - JIT loop cloning - could improve collection inner loops
        • 92296631121c - JIT post-inline cleanup - could also contribute
    • Verification Status: Not verified

    Noise / Borderline Tests

    • Perf_Enumerable.LastWithPredicate(IOrderedEnumerable): -16.3% but z=-1.5 with CV=12.4%. Classified as noise — within historical variance.
    • Perf_FileStream.CopyToFileAsync(1MB, None): -9.0%, z=-1.1 with CV=5.2%. Borderline — weak signal relative to variance.
    • Perf_Enum.StringFormat(32): -11.4%, z=-2.0 with CV=4.1%. Borderline — historical drift weakens attribution.

    Open Questions

    • Historical Data: Available and excellent (297–300 runs per test). No gaps.
    • Confidence Limitations: 38 commits in range with multiple JIT changes makes precise single-commit attribution harder for LINQ tests. Multiple JIT commits could synergistically contribute.
    • Verification Needed: Bisection recommended to isolate whether LINQ improvements come from loop cloning (a2ec76b0) alone or in combination with post-inline cleanup (92296631) or CEA fix (b3db78f4).
    • Bisection Status: Not performed.

    Recommended Actions

    1. Verification: Verify LINQ improvements with RunWithBuildAtHash on commit a2ec76b0691e vs baseline 98d2d533e957 to confirm JIT loop cloning is the cause.
    2. Cross-architecture check: Verify if the same LINQ improvements appear on x64 architecture to confirm JIT optimization is architecture-independent.
    3. Source review: Review b836f4b9a125 threadpool semaphore changes to understand the mechanism behind ~57% Channel and ~25% FileStream async improvements.

    Bisection Results

    Test Status Culprit Commit Relevance Reported Diff (issue) Bisected Diff (at culprit) Duration
    Aggregate(input: IEnumerable) ✅ Success 92296631121c ✅ RELATED 199.9→72.4 ns (-64%) 199.9→72.3 ns (-64%) 1061s
    CopyToFileAsync(fileSize: 104857600, ... ✅ Success b836f4b9a125 ✅ RELATED 213.5→153.7 ms (-28%) 182.1→155.0 ms (-15%) 1156s
    ToFrozenSet(Count: 64) ✅ Success 92296631121c ✅ RELATED 3.2→3.1 μs (-6%) 3.2→3.0 μs (-7%) 921s
    StringFormat(value: 32) ❌ failed - - 283.1→250.8 ns (-11%) — (not measured) 674s
    PingPong ❌ failed - - 29.3→12.5 ns (-57%) — (not measured) 162s

    Total bisection time: 3975s
    Success rate: 3/5 tests

    System.Linq.Tests.Perf_Enumerable.Aggregate(input: IEnumerable)

    • Culprit: 92296631121c
    • Commit Message: JIT: add post-inline cleanup for no-return calls (#128513)
    • Relevance: RELATED
    • Explanation: This commit adds a new JIT phase that trims dead code following no-return calls exposed by inlining, converting those blocks to BBJ_THROW. The Aggregate benchmark exercises LINQ's inlined code paths, and cleaning up unreachable code after inlining produces a tighter flow graph that benefits subsequent optimization phases (GDV resolution, morph), directly improving the generated machine code quality for this workload.

    Helix jobs

    Job ID Submitted by bisection Last status
    7a0e8823-5afa-4dbf-b7bb-a40d964d29f7 ✅ submitted
    bb737b0f-b1ee-40b7-a75c-59f98326edf1 ✅ submitted
    4ae0b9ba-795f-4556-b86b-1fcf68b71458 ✅ completed

    Per-commit measurements

    Commit Position Measurements
    7dc7499c8e5c q1 - index 9 199.590 ns
    772147228c6b mid - index 19 199.720 ns
    4a662a97471e index 20 199.860 ns
    92296631121c index 21 72.340 ns
    db8761084874 index 24 73.120 ns
    1301a507f6a4 index 26 72.380 ns
    5e837f7300b5 q3 - index 28 72.370 ns
    Bisection details

    …[earlier output omitted]

    ● get_single_commit_summary (MCP: PerfTriageMcp) · owner: "dotnet", repo: "runtime", sha: "92296631…
    └ {"index":null,"sha":"92296631121c2eb917f58dfca70864821cba250a","abbrevSh...

    Excellent! I have all the information needed. The culprit commit is a JIT optimization by Andy Ayers that adds a post-inline cleanup phase for no-return calls. This is clearly related to the System.Linq.Tests.Perf_Enumerable.Aggregate test since LINQ's Aggregate method uses inlining heavily, and this JIT improvement cleans up dead code after inlining, producing a smaller/faster flow graph.

    BISECTION RESULT:
    - Culprit Commit: 92296631121c2eb917f58dfca70864821cba250a
    - Commit Message: JIT: add post-inline cleanup for no-return calls (#128513)
    - Commits Tested: 7
    - Confidence: 5
    - Commit Relevance: RELATED
    - Relevance Explanation: This commit adds a new JIT phase that trims dead code following no-return calls exposed by inlining, converting those blocks to BBJ_THROW. The Aggregate benchmark exercises LINQ's inlined code paths, and cleaning up unreachable code after inlining produces a tighter flow graph that benefits subsequent optimization phases (GDV resolution, morph), directly improving the generated machine code quality for this workload.
    - Baseline Value: 199.86 ns
    - Culprit Value: 72.34 ns
    - Summary: Bisected a 38-commit range in 3 Helix jobs. The improvement (~63.8% faster) was cleanly isolated to a single commit that introduces a post-inline no-return cleanup JIT phase, which removes dead code and converts blocks to BBJ_THROW after inlining.
    
    HELIX JOBS:
    - 7a0e8823-5afa-4dbf-b7bb-a40d964d29f7
    - bb737b0f-b1ee-40b7-a75c-59f98326edf1
    - 4ae0b9ba-795f-4556-b86b-1fcf68b71458
    
    MEASUREMENTS:
    - 7dc7499c8e5c (Q1 - index 9): 199.59 ns
    - 772147228c6b (mid - index 19): 199.72 ns
    - 5e837f7300b5 (Q3 - index 28): 72.37 ns
    - 92296631121c (index 21): 72.34 ns
    - db8761084874 (index 24): 73.12 ns
    - 1301a507f6a4 (index 26): 72.38 ns
    - 4a662a97471e (index 20): 199.86 ns
    

    System.IO.Tests.Perf_FileStream.CopyToFileAsync(fileSize: 104857600, options: Asynchronous)

    • Culprit: b836f4b9a125
    • Commit Message: Reapply "A few fixes in the threadpool semaphore. Unify Windows/Unix implementation of LIFO policy." (#125193) (#128606)
    • Relevance: RELATED
    • Explanation: This commit rewrites the threadpool's LowLevelLifoSemaphore, LowLevelLock, and thread wake/sleep policy. The test CopyToFileAsync is an async I/O benchmark that relies heavily on the threadpool for scheduling async completions. The improved LIFO wake policy and reduced spurious thread activity directly benefit async I/O throughput.

    Helix jobs

    Job ID Submitted by bisection Last status
    2f999d17-c486-4e12-9cb7-72b814a65ceb ✅ submitted
    cd35da39-117c-42a6-92b7-19e8533fc042 ✅ submitted
    2c6ad614-4982-4a9c-8f62-0a1117960cb9 ✅ submitted

    Per-commit measurements

    Commit Position Measurements
    a2ec76b0691e q2-quarter 187.030 ms
    b3db78f44230 q2-threequarter 156.600 ms
    f90673945503 q2-mid 157.000 ms
    33b43115a73e pre-culprit 182.050 ms
    5e837f7300b5 threequarter 157.070 ms
    772147228c6b mid 157.510 ms
    7dc7499c8e5c quarter 213.200 ms
    b836f4b9a125 culprit 155.010 ms
    Bisection details

    …[earlier output omitted]

    7928ee19487f793510f575ab347` is the culprit. Let me examine it.

    ● get_single_commit_summary (MCP: PerfTriageMcp) · owner: "dotnet", repo: "runtime", sha: "b836f4b9…
    └ {"index":null,"sha":"b836f4b9a12587928ee19487f793510f575ab347","abbrevSh...

    This commit is clearly related to the test. It's a major threadpool semaphore rewrite that would directly affect async I/O performance. Let me compile the final result.

    BISECTION RESULT:
    - Culprit Commit: b836f4b9a12587928ee19487f793510f575ab347
    - Commit Message: Reapply "A few fixes in the threadpool semaphore. Unify Windows/Unix implementation of LIFO policy." (#125193) (#128606)
    - Commits Tested: 8
    - Confidence: 3
    - Commit Relevance: RELATED
    - Relevance Explanation: This commit rewrites the threadpool's LowLevelLifoSemaphore, LowLevelLock, and thread wake/sleep policy. The test CopyToFileAsync is an async I/O benchmark that relies heavily on the threadpool for scheduling async completions. The improved LIFO wake policy and reduced spurious thread activity directly benefit async I/O throughput.
    - Baseline Value: 182.05 ms (the measured perf at the last-good commit before the culprit, 33b43115a73e)
    - Culprit Value: 155.01 ms (the measured perf at the culprit commit, b836f4b9a125)
    - Summary: Bisected 38 commits using double-bisection. The improvement step from 182ms to 155ms occurs at the threadpool semaphore rewrite commit. Confidence capped at 3/5 because the step magnitude (~27ms) is close to the 2σ noise floor (26.56ms) and intermediate commits showed partial improvement.
    
    HELIX JOBS:
    - 2f999d17-c486-4e12-9cb7-72b814a65ceb
    - cd35da39-117c-42a6-92b7-19e8533fc042
    - 2c6ad614-4982-4a9c-8f62-0a1117960cb9
    
    MEASUREMENTS:
    - 7dc7499c8e5c (quarter): 213.20 ms
    - 772147228c6b (mid): 157.51 ms
    - 5e837f7300b5 (threeQuarter): 157.07 ms
    - a2ec76b0691e (Q2-quarter): 187.03 ms
    - f90673945503 (Q2-mid): 157.00 ms
    - b3db78f44230 (Q2-threeQuarter): 156.60 ms
    - 33b43115a73e (pre-culprit): 182.05 ms
    - b836f4b9a125 (culprit): 155.01 ms
    

    System.Collections.Perf_Frozen.ToFrozenSet(Count: 64)

    • Culprit: 92296631121c
    • Commit Message: JIT: add post-inline cleanup for no-return calls (#128513)
    • Relevance: RELATED
    • Explanation: This JIT commit adds a phase that trims dead code following inlined no-return calls (throw helpers) and converts blocks to BBJ_THROW, producing cleaner flow graphs. FrozenSet construction code uses ThrowHelper methods extensively; after inlining, the cleaner CFG enables better optimization of the hot allocation/hashing path, explaining the ~6% improvement.

    Helix jobs

    Job ID Submitted by bisection Last status
    52e96fb8-58f2-4416-acb5-f0dd75894dad ✅ submitted
    7c934948-276c-4be2-8aa3-27f45d967b8d ✅ submitted
    d0aa947e-4230-4e4a-80e8-9966b38f4dfd ✅ completed

    Per-commit measurements

    Commit Position Measurements
    7dc7499c8e5c q1 3.229, 3.229 μs
    5e837f7300b5 q3 3.042, 3.042 μs
    772147228c6b mid index 19 3.229, 3.229 μs
    4a662a97471e index 20 3.250 μs
    92296631121c index 21 3.026 μs
    db876108487 index 24 3.034 μs
    1301a507f6a4 index 26 3.049 μs
    Bisection details

    …[earlier output omitted]

    • 4a662a97 (index 20): 3250 ns (baseline)
    • 92296631 (index 21): 3026 ns (improved)

    The culprit is commit 92296631121c2eb917f58dfca70864821cba250a. Let me examine it.

    ● get_single_commit_summary (MCP: PerfTriageMcp) · owner: "dotnet", repo: "runtime", sha: "92296631…
    └ {"index":null,"sha":"92296631121c2eb917f58dfca70864821cba250a","abbrevSh...

    Now I have all the data needed. The culprit commit is 92296631121c2eb917f58dfca70864821cba250a — a JIT optimization that trims dead code after no-return calls exposed by inlining. This directly improves codegen for collections code that uses throw helpers.

    BISECTION RESULT:
    - Culprit Commit: 92296631121c2eb917f58dfca70864821cba250a
    - Commit Message: JIT: add post-inline cleanup for no-return calls (#128513)
    - Commits Tested: 7
    - Confidence: 4
    - Commit Relevance: RELATED
    - Relevance Explanation: This JIT commit adds a phase that trims dead code following inlined no-return calls (throw helpers) and converts blocks to BBJ_THROW, producing cleaner flow graphs. FrozenSet construction code uses ThrowHelper methods extensively; after inlining, the cleaner CFG enables better optimization of the hot allocation/hashing path, explaining the ~6% improvement.
    - Baseline Value: 3249.73 ns
    - Culprit Value: 3025.59 ns
    - Summary: Double-bisection narrowed the improvement from 38 commits to the boundary between 4a662a97 (baseline-like, 3250 ns) and 92296631 (improved, 3026 ns). The step change of ~224 ns (6.9%) well exceeds the 2σ noise floor of ~80 ns, giving high confidence in this result.
    
    HELIX JOBS:
    - 52e96fb8-58f2-4416-acb5-f0dd75894dad
    - 7c934948-276c-4be2-8aa3-27f45d967b8d
    - d0aa947e-4230-4e4a-80e8-9966b38f4dfd
    
    MEASUREMENTS:
    - 7dc7499c8e5c (Q1 index 9): 3229.22 ns
    - 772147228c6b (mid index 19): 3229.21 ns
    - 5e837f7300b5 (Q3 index 28): 3041.87 ns
    - 92296631121c (index 21): 3025.59 ns
    - db876108487 (index 24): 3034.09 ns
    - 1301a507f6a4 (index 26): 3049.19 ns
    - 4a662a97471e (index 20): 3249.73 ns
    

    System.Tests.Perf_Enum.StringFormat(value: 32)

    • Status: failed

    Helix jobs

    Job ID Submitted by bisection Last status
    9dbc0842-325e-466b-98cc-226f78fb972a ✅ submitted
    Bisection details

    …[earlier output omitted]

    ✗ get_helix_job_result (MCP: PerfTriageMcp) · jobId: "9dbc0842-325e-466b-98cc-226f78fb972a"
    └ MCP server 'PerfTriageMcp': TypeError: fetch failed

    ✗ get_helix_job_result (MCP: PerfTriageMcp) · jobId: "9dbc0842-325e-466b-98cc-226f78fb972a"
    └ MCP server 'PerfTriageMcp': TypeError: fetch failed

    ✗ get_helix_job_result (MCP: PerfTriageMcp) · jobId: "9dbc0842-325e-466b-98cc-226f78fb972a"
    └ MCP server 'PerfTriageMcp': TypeError: fetch failed

    ✗ get_helix_job_result (MCP: PerfTriageMcp) · jobId: "9dbc0842-325e-466b-98cc-226f78fb972a"
    └ MCP server 'PerfTriageMcp': TypeError: fetch failed

    ✗ get_helix_job_result (MCP: PerfTriageMcp) · jobId: "9dbc0842-325e-466b-98cc-226f78fb972a"
    └ MCP server 'PerfTriageMcp': TypeError: fetch failed

    The MCP server has been consistently failing with "TypeError: fetch failed" for an extended period. The Helix job was successfully submitted and was running, but I cannot retrieve results due to persistent connectivity issues with the PerfTriageMcp server.

    BISECTION FAILED:
    - Reason: MCP server connectivity failure - persistent "TypeError: fetch failed" errors when polling GetHelixJobResult
    - Helix Errors: Job 9dbc0842-325e-466b-98cc-226f78fb972a was submitted successfully and showed "running" status with 2 work items, but subsequent GetHelixJobResult calls all returned "MCP server 'PerfTriageMcp': TypeError: fetch failed"
    - What was attempted: 1) Got commit range (38 commits between 98d2d533e957 and 2790c60428c3). 2) Used GetDoubleBisectCommits to select 3 test points (7dc7499, 7721472, 5e837f7). 3) Submitted Helix job with SubmitHelixJob (job ID: 9dbc0842-325e-466b-98cc-226f78fb972a). 4) Polled GetHelixJobResult ~80+ times - initial polls returned "running" status, then all subsequent calls failed with TypeError: fetch failed.
    - What is needed: Restore MCP server connectivity (PerfTriageMcp endpoint), then retry polling job 9dbc0842-325e-466b-98cc-226f78fb972a or resubmit bisection jobs.
    

    System.Threading.Channels.Tests.UnboundedChannelPerfTests.PingPong

    • Status: failed
    Bisection details

    …[earlier output omitted]

    │ /app/output/logs/74413/bisection/process-1781173233736-635.log 2>/dev/null
    └ 105 lines...

    ● List bisection responses (shell)
    │ ls /app/output/logs/74413/bisection/responses/
    └ 5 lines...

    ● Find Helix tool references (shell)
    │ grep -r "GetCommitRangeHashes|SubmitHelixJob|GetHelixJobResult|RunWithBui
    │ ldAtHash" /app/ --include="*.py" -l 2>/dev/null
    └ 7 lines...

    ● Check how bisection agent uses tools (shell)
    │ grep -A5 "SubmitHelixJob|GetCommitRangeHashes"
    │ /app/perf_triage/engine/bisection_agent.py | head -60
    └ 61 lines...

    ● Check for alternative MCP access (shell)
    │ # Try to reach MCP server on any alternative ports or check if there's a
    │ way to start it
    │ curl -s http://localhost:5588/tools 2>&1 | head -5
    │ curl -s http://localhost:5589/health 2>&1 | head -5
    │ # Check if dotnet is available to start the server…
    └ 5 lines...

    The MCP server providing bisection tools (GetCommitRangeHashes, SubmitHelixJob, GetHelixJobResult) is not running at localhost:5588 and cannot be started. I cannot submit Helix jobs to perform the actual bisection.

    BISECTION FAILED:
    - Reason: MCP server (localhost:5588) providing Helix bisection tools is not running and cannot be started
    - Helix Errors: Connection refused on localhost:5588 - no MCP server process available to handle GetCommitRangeHashes/SubmitHelixJob/GetHelixJobResult tool calls
    - What was attempted: Checked MCP server health at TRIAGE_MCP_BASE_URL (http://localhost:5588), searched for alternative endpoints, verified no dotnet runtime available to start the MCPServer.HttpHost project, confirmed tools are not available in the current tool set
    - What is needed: The PerfTriage MCP HTTP server must be running at localhost:5588 (or TRIAGE_MCP_BASE_URL) to provide GetCommitRangeHashes, SubmitHelixJob, and GetHelixJobResult tools. Either start the server before retrying, or provide these MCP tools directly to the agent's tool set.
    

    🤖 Proposed Next Actions

    Rule: R2_known_improvement — Known-cause improvement — link & close.

    Verified improvement attributed to commit 92296631121c (finding 5/5, improvement 5/5, bisection RELATED).

    # Action Status Details
    1 Back-reference cause PR 🕒 Planned on culprit PR for 92296631121c
    2 Remove label 🕒 Planned untriaged
    3 Close issue 🕒 Planned reason completed

    Generated by PerfTriageAgent on 2026-06-11 10:23 UTC

Sign up for free to join this conversation on GitHub. Already have an account? Sign in to comment

Metadata

Metadata

Assignees

No one assigned

    Type

    No type

    Projects

    No projects

      Milestone

      No milestone

      Relationships

      None yet

      Development

      No branches or pull requests

      Issue actions