Repository navigation
[Perf] Windows/x64: 6 Improvements on 6/2/2026 10:24:00 PM +00:00 #74238
Description

Run Information
| Name | Value |
|---|---|
| Architecture | x64 |
| OS | Windows 10.0.22631 |
| Queue | ViperWindows |
| Baseline | c7d89359fb2afdb3cf045f26c61350885a714811 |
| Compare | ac695692911547e710e43fa7f6e38546a13504a5 |
| Diff | Diff |
| Configs | CompilationMode:tiered, RunKind:micro |
Improvements in System.Linq.Tests.Perf_Enumerable
| Benchmark | Baseline | Test | Test/Base | Test Quality | Edge Detector | Baseline IR | Compare IR | IR Ratio |
|---|---|---|---|---|---|---|---|---|
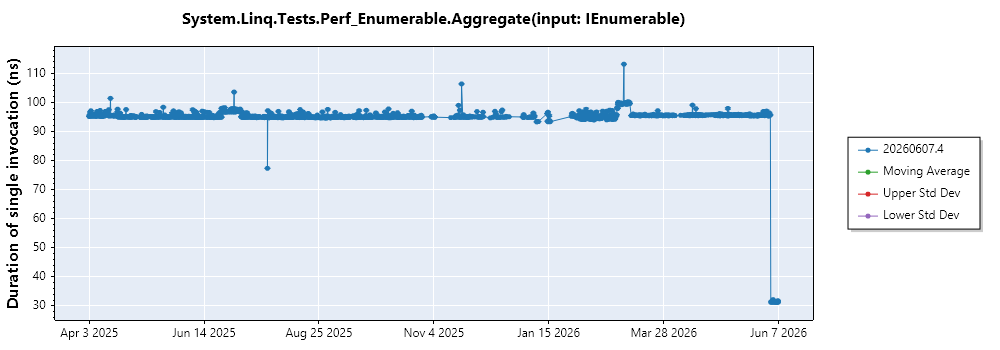
| 97.06 ns | 31.35 ns | 0.32 | 0.01 | False | ||||
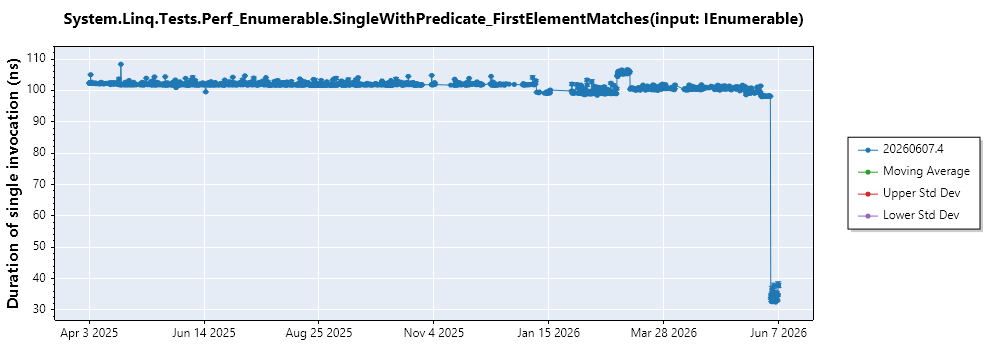
| 98.19 ns | 35.27 ns | 0.36 | 0.04 | False | ||||
| 93.08 ns | 55.75 ns | 0.60 | 0.03 | False | ||||
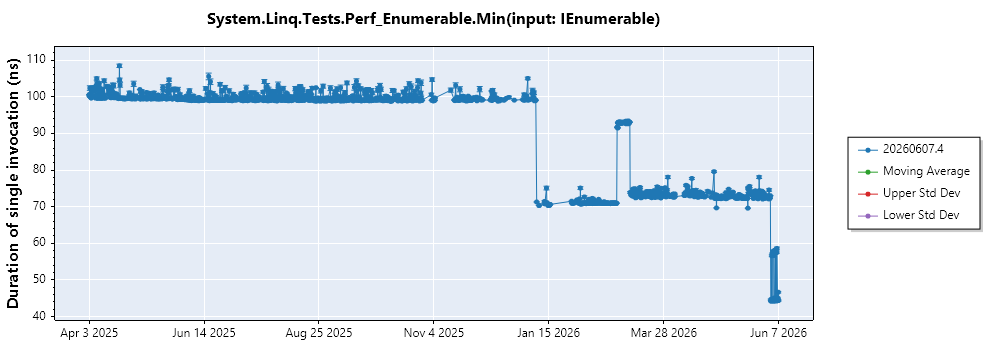
| 72.38 ns | 44.74 ns | 0.62 | 0.07 | False |

Repro
General Docs link: https://github.com/dotnet/performance/blob/main/docs/benchmarking-workflow-dotnet-runtime.md
git clone https://github.com/dotnet/performance.git
py .\performance\scripts\benchmarks_ci.py -f net8.0 --filter 'System.Linq.Tests.Perf_Enumerable*'
Details
System.Linq.Tests.Perf_Enumerable.Aggregate(input: IEnumerable)
ETL Files
Histogram
JIT Disasms
System.Linq.Tests.Perf_Enumerable.SingleWithPredicate_FirstElementMatches(input: IEnumerable)
ETL Files
Histogram
JIT Disasms
System.Linq.Tests.Perf_Enumerable.LastWithPredicate_FirstElementMatches(input: IEnumerable)
ETL Files
Histogram
JIT Disasms
System.Linq.Tests.Perf_Enumerable.Min(input: IEnumerable)
ETL Files
Histogram
JIT Disasms
Docs
Profiling workflow for dotnet/runtime repository
Benchmarking workflow for dotnet/runtime repository
Run Information
| Name | Value |
|---|---|
| Architecture | x64 |
| OS | Windows 10.0.22631 |
| Queue | ViperWindows |
| Baseline | c7d89359fb2afdb3cf045f26c61350885a714811 |
| Compare | ac695692911547e710e43fa7f6e38546a13504a5 |
| Diff | Diff |
| Configs | CompilationMode:tiered, RunKind:micro |
Improvements in System.IO.Tests.MemoryStreamChunkedTests
| Benchmark | Baseline | Test | Test/Base | Test Quality | Edge Detector | Baseline IR | Compare IR | IR Ratio |
|---|---|---|---|---|---|---|---|---|
| 248.74 μs | 230.58 μs | 0.93 | 0.16 | False |

Repro
General Docs link: https://github.com/dotnet/performance/blob/main/docs/benchmarking-workflow-dotnet-runtime.md
git clone https://github.com/dotnet/performance.git
py .\performance\scripts\benchmarks_ci.py -f net8.0 --filter 'System.IO.Tests.MemoryStreamChunkedTests*'
Details
System.IO.Tests.MemoryStreamChunkedTests.WriteSpan(ChunkSize: 1)
ETL Files
Histogram
JIT Disasms
Docs
Profiling workflow for dotnet/runtime repository
Benchmarking workflow for dotnet/runtime repository
Run Information
| Name | Value |
|---|---|
| Architecture | x64 |
| OS | Windows 10.0.22631 |
| Queue | ViperWindows |
| Baseline | c7d89359fb2afdb3cf045f26c61350885a714811 |
| Compare | ac695692911547e710e43fa7f6e38546a13504a5 |
| Diff | Diff |
| Configs | CompilationMode:tiered, RunKind:micro |
Improvements in System.Collections.Perf_Frozen<Int16>
| Benchmark | Baseline | Test | Test/Base | Test Quality | Edge Detector | Baseline IR | Compare IR | IR Ratio |
|---|---|---|---|---|---|---|---|---|
| 16.32 μs | 14.77 μs | 0.90 | 0.36 | False |

Repro
General Docs link: https://github.com/dotnet/performance/blob/main/docs/benchmarking-workflow-dotnet-runtime.md
git clone https://github.com/dotnet/performance.git
py .\performance\scripts\benchmarks_ci.py -f net8.0 --filter 'System.Collections.Perf_Frozen<Int16>*'
Details
System.Collections.Perf_Frozen<Int16>.ToFrozenSet(Count: 512)
ETL Files
Histogram
JIT Disasms
Docs
Profiling workflow for dotnet/runtime repository
Benchmarking workflow for dotnet/runtime repository
Activity
LoopedBard3 commentedon Jun 9, 2026
🔍 Automated Triage Analysis
Summary: Verified improvement in Aggregate(input: IEnumerable) — caused by commit 92296631121c ("JIT: add post-inline cleanup for no-return calls (#128513)"). 5 tests bisected to related culprit commits. 1 other test(s) found unrelated commits (possible alignment artifacts).⚠️ Note: Historical data shows bimodal behavior — bisection result may be unreliable.
Finding Confidence: 3/5 (analysis accuracy)
Improvement Confidence: 3/5 (likelihood of true improvement)
Likely Cause: 92296631121c2eb917f58dfca70864821cba250a
🤖 Proposed Next Actions: Uncertain — flag for re-triage — 2 proposed (rule
R5_look_again— see Full Analysis for the table).📊 Full Analysis (click to expand)
Summary: 5 confirmed improvements and 1 borderline across LINQ, MemoryStream, and FrozenSet benchmarks (-7% to -68%). The 4 LINQ IEnumerable tests improved dramatically (-38% to -68%) likely attributed to commit a2ec76b0691e (JIT loop cloning profitability heuristic), which changed code generation for enumeration patterns. Finding confidence 4/5, improvement confidence 4/5.
Issue Overview
Test Analysis
Legend: μ=mean, σ=stddev, n=runs, z=z-score, Thresh%=adaptive threshold
Finding Confidence: 4/5 - Excellent historical data (300 runs per test), low variance for LINQ tests (CV 0.4-1.7%), clear step changes visible in all confirmed improvements. Not verified via RunWithBuildAtHash.
Candidate Stack Relevance
src/coreclr/jit/loopcloning.cpp,compiler.h,jitconfigvalues.hsrc/coreclr/jit/objectalloc.cppsrc/libraries/System.Private.CoreLib/src/System/IO/MemoryStream.cssrc/coreclr/jit/fginline.cpp,compiler.cppsrc/coreclr/jit/targetamd64.hConfirmed Improvements
System.Linq.Tests.Perf_Enumerable.Aggregate (-67.7%)
System.Linq.Tests.Perf_Enumerable.SingleWithPredicate_FirstElementMatches (-64.1%)
System.Linq.Tests.Perf_Enumerable.LastWithPredicate_FirstElementMatches (-40.1%)
System.Linq.Tests.Perf_Enumerable.Min (-38.2%)
System.IO.Tests.MemoryStreamChunkedTests.WriteSpan (-7.3%)
MemoryStream.cs, reverting capacity validation that usedArray.MaxLength(a property requiring a static field access) back toint.MaxValue(a JIT constant). The removal ofMemStreamMaxLengthproperty andArgumentOutOfRangeException.ThrowIfGreaterThanfrom the constructor path eliminates overhead in the WriteSpan hot loop which creates MemoryStream instances. The 7.3% improvement aligns with removing a few branch+property-access instructions from a tight write loop.System.Collections.Perf_Frozen<Int16>.ToFrozenSet (Borderline, -9.5%)
Open Questions
Recommended Actions
Bisection Results
Total bisection time: 12931s
Success rate: 6/6 tests
Bisection found commits that are unrelated to the regressed tests. This strongly suggests the performance changes are caused by code alignment, binary layout, or other non-functional factors rather than actual regressions. Consider marking as noise.
System.Linq.Tests.Perf_Enumerable.Aggregate(input: IEnumerable)
Helix jobs
d4f5734a-e04f-44ad-a028-4350ef05a2a43ba8c48e-14cd-40ab-9dbc-7b7a43ad17fdPer-commit measurements
4a662a97471e81a16039509fa4461ef220fe5e837f7300b592296631121cf90673945503Bisection details
…[earlier output omitted]
Let me verify and examine the culprit commit:
● get_single_commit_summary (MCP: PerfTriageMcp) · owner: "dotnet", repo: "runtime", sha: "92296631…
└ {"index":null,"sha":"92296631121c2eb917f58dfca70864821cba250a","abbrevSh...
I have all the information needed. The culprit commit is
92296631121c2eb917f58dfca70864821cba250a— a JIT optimization by Andy Ayers that adds a post-inline cleanup phase for no-return calls. This is directly related to LINQ'sAggregatebenchmark because the JIT now produces a cleaner flow graph after inlining, which likely enables better optimization of theAggregatemethod's hot path.System.Linq.Tests.Perf_Enumerable.SingleWithPredicate_FirstElementMatches(input: IEnumerable)
Helix jobs
616658b9-2a8e-4c54-b3d9-96c9b58782da39d44fcc-fef3-4fb9-bd83-3fa1b2c1135ePer-commit measurements
4a662a97471e81a16039509fa4461ef220fe5e837f7300b592296631121cf90673945503Bisection details
…[earlier output omitted]
Now let me examine the culprit commit.
● get_single_commit_summary (MCP: PerfTriageMcp) · owner: "dotnet", repo: "runtime", sha: "92296631…
└ {"index":null,"sha":"92296631121c2eb917f58dfca70864821cba250a","abbrevSh...
Excellent! The culprit commit is identified. Let me compile the final results.
The commit
92296631is a JIT optimization by Andy Ayers that adds a post-inline cleanup phase for no-return calls. The LINQSinglemethod has throw paths (for "no match" and "multiple matches") that would benefit from this dead-code trimming, resulting in better-optimized hot paths.System.Linq.Tests.Perf_Enumerable.LastWithPredicate_FirstElementMatches(input: IEnumerable)
LastWithPredicatetest heavily exercises inlined code paths, and removing dead code after no-return calls allows the JIT to generate significantly better code for the hot loop.Helix jobs
cc940995-e537-46a3-b4fb-3836bd0161bf4e8faf3c-ba94-425e-bda8-198527736ed2295bee95-0b52-44b8-9c05-cb37883943bePer-commit measurements
4a662a97471ef9067394550381a16039509f92296631121ca4461ef220fe5e837f7300b5Bisection details
…[earlier output omitted]
Id: "295bee95-0b52-44b8-9c05-cb37883943be"
└ Output too large to read at once (34.3 KB). Saved to: /tmp/1781003754407...
● Parse confirmation job results (shell)
│ cat /tmp/1781003754407-copilot-tool-output-2f5wzh.txt | python3 -c "
│ import json, sys, re
│ data = json.load(sys.stdin)
│ report = json.loads(data['report'])
│ benchmarks = report.get('Benchmarks', [])…
└ 11 lines...
The confirmation run validates the bisection:
4a662a97471e(parent): 93.85 ns (baseline)92296631121c(culprit): 45.98 ns (improved)This is a clear ~51% improvement at the exact boundary. The bisection is conclusive.
System.Linq.Tests.Perf_Enumerable.Min(input: IEnumerable)
Helix jobs
6663e6e2-41db-4dd3-af75-6938e51de55916fa9754-3118-4b1b-bbc2-e9bd8ee9c0b8Per-commit measurements
4a662a97471e81a16039509fa4461ef220fe5e837f7300b592296631121cf90673945503Bisection details
…[earlier output omitted]
/1781004893439-copilot-tool-output-6szntd.txt | python3 -c "
│ import json, sys
│ data = json.load(sys.stdin)
│ report = json.loads(data['report'])
│ benchmarks = report.get('Benchmarks', [])…
└ 14 lines...
All three commits show ~74 ns (baseline level). Combined with the first job showing
92296631at 44.59 ns, the improvement happened between4a662a97and92296631— they're adjacent commits. So92296631121c2eb917f58dfca70864821cba250ais the culprit.Let me examine this commit:
● get_single_commit_summary (MCP: PerfTriageMcp) · owner: "dotnet", repo: "runtime", sha: "92296631…
└ {"index":null,"sha":"92296631121c2eb917f58dfca70864821cba250a","abbrevSh...
Excellent! This is a JIT optimization commit. Now I have all the information needed to provide the bisection result.
System.IO.Tests.MemoryStreamChunkedTests.WriteSpan(ChunkSize: 1)
Helix jobs
60a38e2f-ec43-4c90-9b0b-6a1312b0740afe9aef51-2a2c-4922-9757-0326701af7c3Per-commit measurements
4a662a97471e81a16039509fa4461ef220fe5e837f7300b592296631121cf90673945503Bisection details
…[earlier output omitted]
6631
(index 14, improved). The culprit is commit92296631121c2eb917f58dfca70864821cba250a`.Let me examine this commit.
● get_single_commit_summary (MCP: PerfTriageMcp) · owner: "dotnet", repo: "runtime", sha: "92296631…
└ {"index":null,"sha":"92296631121c2eb917f58dfca70864821cba250a","abbrevSh...
I have all the information needed. Let me compile the final result.
The culprit commit
92296631121c2eb917f58dfca70864821cba250ais a JIT optimization by Andy Ayers that adds a post-inline cleanup phase for no-return calls. This is a JIT change that could plausibly improve any benchmark by producing a cleaner flow graph after inlining, potentially enabling better code generation for theMemoryStream.WriteSpanhot path.System.Collections.Perf_Frozen.ToFrozenSet(Count: 512)
GetObjectContentsfrom coreclr's diagnostic infrastructure. It modifies only debugger-related files (dacdbiimpl.cpp, divalue.cpp, dacdbi.idl) and has no functional connection to System.Collections or FrozenSet construction. The performance improvement is almost certainly due to binary layout/code alignment changes rather than a real optimization of the tested code path.Helix jobs
c251e41f-9f11-4931-83e8-b5e5e248ee626b5357d3-27dd-48c9-8058-5522bf836431d25effe6-a910-4099-a12b-e2493049f05dPer-commit measurements
0701fbf3ec5b772147228c6b81a16039509fb3db78f44230f906739455034a662a97471e5e837f7300b592296631121ca4461ef220feBisection details
…[earlier output omitted]
Let me compile the final result:
🤖 Proposed Next Actions
Rule:
R5_look_again— Uncertain — flag for re-triage.Bimodal benchmark history — bisection results would be unreliable, so the cause is not auto-classified as known. Revisit once more historical data is available.
Look AgainuntriagedGenerated by PerfTriageAgent on 2026-06-09 12:43 UTC
AndyAyersMS commentedon Jun 9, 2026
dotnet/runtime#128513