Repository navigation
Metrics not appearing at 1 minute resolution as expected #406

Description

I am publishing metrics like this
"""Logging metedata utils"""
import os
import time

from aws_lambda_powertools import Logger, Metrics
from aws_lambda_powertools.metrics import MetricUnit

METRICS = Metrics()
METRICS.add_dimension(name="environment", value=os.environ["NODE_ENV"])

LOGGER = Logger(child=True)

def log_processing_statistics(start_processing_timestamp, annotation_metadata):
    """
    Logs some metrics on how long it took to process or receive items.

    :param start_processing_timestamp: when we started processing an annotation
    :param dict annotation_metadata: keys include end_timestamp and queue_arrival_timestamp
    """
    now = time.time()
    queue_arrival_timestamp = annotation_metadata["queue_arrival_timestamp"]
    queue_to_processed_time = now - queue_arrival_timestamp
    LOGGER.info("[META]:queue_to_processed_time: %.2f", queue_to_processed_time)
    METRICS.add_metric(name="entrance_counter_queue_to_processed_time",
                       unit=MetricUnit.Seconds,
                       value=queue_to_processed_time)
Where my lambda handler top level function has been decorated like this:
METRICS = Metrics()
METRICS.add_dimension(name="environment", value=os.environ["NODE_ENV"])
LOGGER = Logger(datefmt="%Y-%m-%dT%H:%M:%SZ")
LOGGER._logger.handlers[0].formatter.converter = time.gmtime  #pylint: disable = protected-access
log.initialize_structured_logging()
TRACER = Tracer()  # Sets service via env var

@METRICS.log_metrics(capture_cold_start_metric=
                     os.environ.get("POWERTOOLS_METRICS_CAPTURE_COLD_START",
                                    "false").lower() == "true")
@TRACER.capture_lambda_handler(capture_error=True)
I expect to see cloudwatch metrics here being logged every few minutes; but instead, I see them every 40 minutes or so; or at least at erratic times with a much larger interval than they are being logged.
e.g.
I have checked my cloudwatch logs and found the following two entries suggesting that on some level things are working as expected:
{
    "_aws": {
        "Timestamp": 1618965743152,
        "CloudWatchMetrics": [
            {
                "Namespace": "ThriEntranceCounterLambdaGenesis",
                "Dimensions": [
                    [
                        "service"
                    ]
                ],
                "Metrics": [
                    {
                        "Name": "entrance_counter_queue_to_processed_time",
                        "Unit": "Seconds"
                    }
                ]
            }
        ]
    },
    "service": "ThriEntranceCounterLambdaGenesis",
    "entrance_counter_queue_to_processed_time": [
        60.368706703186035
    ]
}
and
{
    "_aws": {
        "Timestamp": 1618965868129,
        "CloudWatchMetrics": [
            {
                "Namespace": "ThriEntranceCounterLambdaGenesis",
                "Dimensions": [
                    [
                        "service"
                    ]
                ],
                "Metrics": [
                    {
                        "Name": "entrance_counter_queue_to_processed_time",
                        "Unit": "Seconds"
                    }
                ]
            }
        ]
    },
    "service": "ThriEntranceCounterLambdaGenesis",
    "entrance_counter_queue_to_processed_time": [
        64.84194445610046
    ]
}
So would expect to see a metric at 1618965743152 and 1618965868129
or Wednesday, 21 April 2021 09:42:23.152 GMT+09:00 and Wednesday, 21 April 2021 09:44:28.129 GMT+09:00 respectively.
But instead, I see the following when aggregating at 1-second sum:
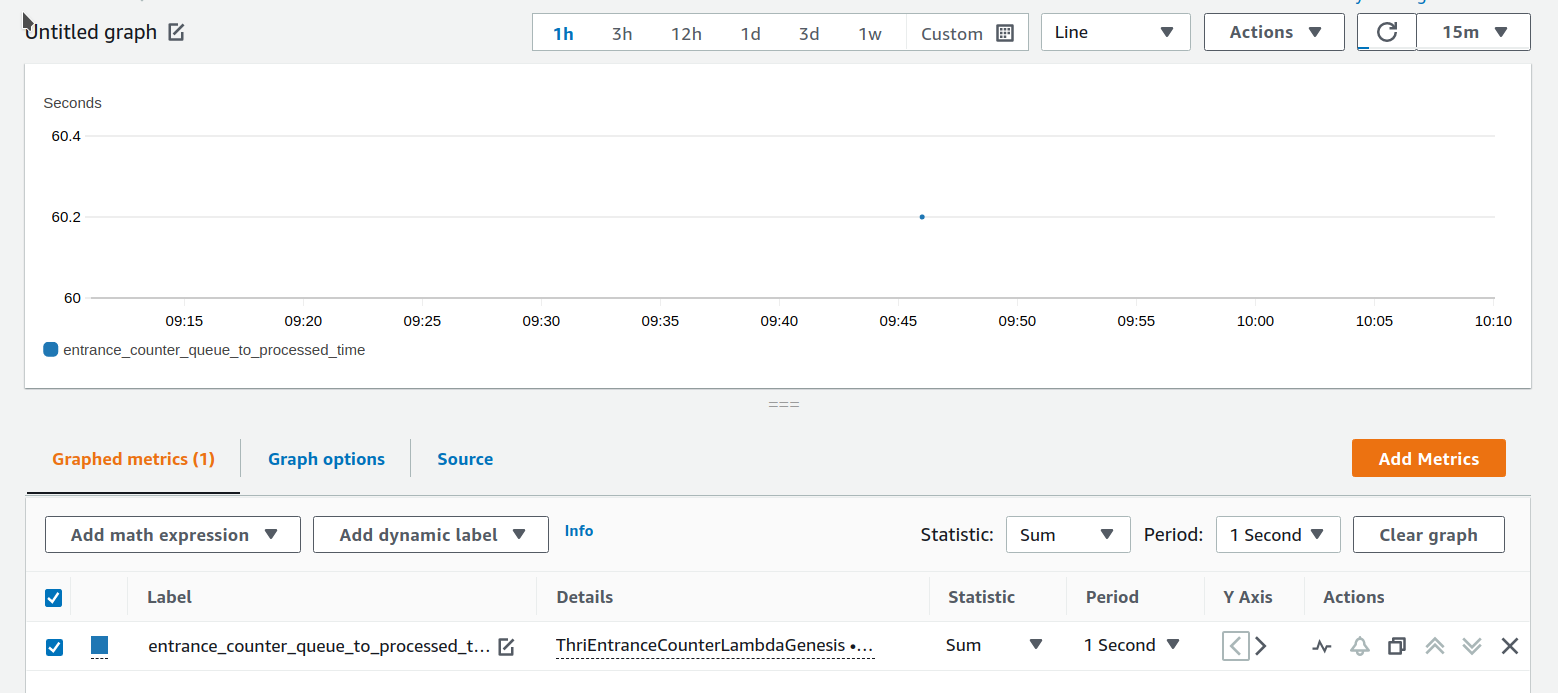
Am I using this functionality wrong? Or is there some sort of built in default aggregation over a large time period somewhere?
Environment
- Powertools version used:
aws-lambda-powertools==1.12.0 - Packaging format (Layers, PyPi)
A layer created with:
aws-lambda-powertools==1.12.0
boto3==1.17.8
botocore==1.20.8
pytz==2021.1
sentry-sdk==0.20.2
typeguard==2.10.0
- AWS Lambda function runtime:
Python 3.7
Activity
heitorlessa commentedon Apr 21, 2021
Hey @bml1g12 - thanks for raising this.
As the metric timestamp is in the logs, there seems to be an issue with CloudWatch EMF backend processing them, or 1s resolution isn't supported (can't find in the docs) -- if the latter is correct, you can try switching to 1 minute to confirm if data points appear correctly in the console, as the Console will fallback to aggregate metrics that don't support lower resolutions.
Could you please open up a support case with these metric objects in the logs and console screenshot?
@jaredcnance - does this ring a bell as metrics are being logged correctly?
I'll try to reproduce that this week.
bml1g12 commentedon Apr 21, 2021
Setting 1-minute aggregation gives same result
OK, by a support case, you mean with AWS Support directly as opposed to a github issue right?
bml1g12 commentedon Apr 21, 2021
The AWS account that I experienced this issue within does not have a support plan sufficient for me to create a technical support case; but I could make one using a different account I have access to which does have this support if you think that would be wise?
heitorlessa commentedon Apr 21, 2021
If you can create in another account, you'd need to reproduce this issue there too as Support cannot provide cross-account support (unless it's Enterprise Support).
I pinged the CloudWatch team in the meantime :)
bml1g12 commentedon Apr 21, 2021
That's a shame; I tried to reproduce this on a dummy lambda function but could not manage to reproduce the same issue so not confident I will be able to reproduce it in a separate account (as it would require running the whole end to end system), yet it persists in our production system so I think there is a genuine issue somewhere.
Thanks for pinging the cloudwatch team, I appreciate any help on this one as it's puzzling. From your message above I gather powertools just logs a message to cloudwatch in the correct format for metrics; and then its the responsibility of the cloudwatch EMF backend to deal with it, and as such it cannot be a bug in the aws-lambda-powertools library itself?
I am logging
So I can create a manual log filter to get the metric if needed but I was doing this before I discovered aws-lambda-powertools, and thought that the metric decorator of aws-lambda-powertools is more elegant, because if I delete a lambda stack the associated manual log filter needs re-configuring to point to the correct log again.
jaredcnance commentedon Apr 21, 2021
EMF does not support 1 second time resolution. What is the reported sample count for the metric in question? Also, this appears to be a one off issue that you haven't been able to reproduce, is that correct?
A couple follow up questions on this:
heitorlessa commentedon Apr 21, 2021
I'm trying to figure out whether that is still the case or if it was a transient issue, since I too can't reproduce it on my end.
If it is consistent, could you shoot me an email with the following info?
I'll create a ticket with CloudWatch directly as an exception here, as this seems like a transient issue on CloudWatch side (EMF blob is being generated correctly by the library here)
Thanks a lot
bml1g12 commentedon Apr 22, 2021
It is indeed consistent; I will send an email, thank you.
heitorlessa commentedon Apr 22, 2021
Thanks a lot for sending that info over - we now know this is happening because of that Metric Dimension
environmentbeing added outside the Lambda Handler which only gets executed during cold starts.@pcolazurdo and I looked over all metric data points and we can clearly see it creating two metrics.
Here's what you can do to fix now and what we'll do to make it less error prone:
Before
After
What happens is that CloudWatch understands a metric to be unique as a combination of Metric + Dimension(s) name. By looking at your logs you'll see this key here:
{
    "_aws": {
        "Timestamp": 1618965868129,
        "CloudWatchMetrics": [
            {
                "Namespace": "ThriEntranceCounterLambdaGenesis",
                "Dimensions": [
                    [
                        "service"
                    ]
                ],
This would be different during cold start as you'd have, hence why a single data point and why it's consistent and also why we couldn't reproduce in our accounts:
{
    "_aws": {
        "Timestamp": 1618965868129,
        "CloudWatchMetrics": [
            {
                "Namespace": "ThriEntranceCounterLambdaGenesis",
                "Dimensions": [
                    [
                        "service",
                        "environment"
                    ]
                ],
Moving forward
@pcolazurdo and I talked about making it easier to define dimensions that should always be available for all metrics, plus some documentation updates. This is what we're going to do for next week's release:
**Add a new method
metrics.set_default_dimensions(). This will help make this less error prone by ensuring you always have these dimensions added at all times, sincelog_metricsnot only flush EMF metrics to the logs but also clean up everything in-memory - This includes old metrics, old dimensions, etc. If we were not to flush dimensions at the end of each invocation this would lead to bad data and additional costs, instead, we will add them if you use this new parameter.Update docs to clarify examples with dimensions. We will update the docs docs to have all
add_dimensioninside a Lambda handler to ensure this does not happen again. We will also add a banner and a section to call out this behaviour as it's not explicit enough.Please let us know how that goes in the meantime we make these fixes, and our sincere apologies for the inconvenience caused.
bml1g12 commentedon Apr 22, 2021
Oh wow, thanks for the clear explanation and for helping me debug this one.
It is quite surprising behaviour to me; as in the non-cold start runs; I would have thought this data would persist between invocations in the same way that the Metrics() instance itself persists between cold starts.
I presume this should work too?
heitorlessa commentedon Apr 22, 2021
Yes @bml1g12 it works too. Anything inside the
def main(event, context)will always be called for every Lambda invocation.What happens here is that Lambda web service 1/
importsyour code, then 2/ call your handler function (mainhere)` with the event and Lambda context. Subsequent Lambda invocations it simply performs 2 if there is a "container" (known as Lambda Execution Context) available.That is why your
add_dimensionand anything for the matter would only be initialized once. It has its pros and cons, and sadly in this case was a con in the way the code was written.I'm finishing the Logger refactor PR and will add a new method that you can safely add anywhere you want to prevent this from happening:
METRICS.set_default_dimensions.heitorlessa commentedon Apr 22, 2021
What happens from a data persisting point of view is that when using
log_metricsdecorator, we need to do the following at the end of each invocation:If we don't do step 2, you'll have metrics and dimensions that you might not want. This could lead to many side effects too.
In any case, moving to the handler works, and we will address these points as I mentioned earlier so they won't confuse anyone anymore.
heitorlessa commentedon Apr 22, 2021
I've added the new
set_default_dimensionsto do this properly, updated the docs with examples, updatedTestingsection in docs to be more explicit to catch these earlier, and updated all examples to use a Lambda Handler to ensure no one accidentally copies examples and hit this.I'll add one extra banner to make even more explicit, but would be grateful if you believe this resolves this confusion further.
PR: #410
Thank you @bml1g12
bml1g12 commentedon Apr 22, 2021
Yup LGTM, I'm happy to close this topic, but haven't had a chance to test the fix yet
heitorlessa commentedon Apr 23, 2021
bml1g12 commentedon Apr 27, 2021
Moving to inside the handler resolved this issue; thanks for the support!
heitorlessa commentedon Apr 27, 2021
Awesome to hear! This is the new docs with the new feature to make this process less error prone, all examples were updated to be inside the handler to reflect this discussion, and I added a warning banner just above this section as promised
https://awslabs.github.io/aws-lambda-powertools-python/develop/core/metrics/#adding-default-dimensions