Repository navigation
Excessive delay and memory usage when calling unsupported Numpy functions on TimeSeries.time #10688
Description

Description
Trying to call unsupported Numpy ufuncs or other functions like np.isnan or np.mean on a Time objects raises an exception, offering an (implicit) reminder to directly use the np.array via t.value.
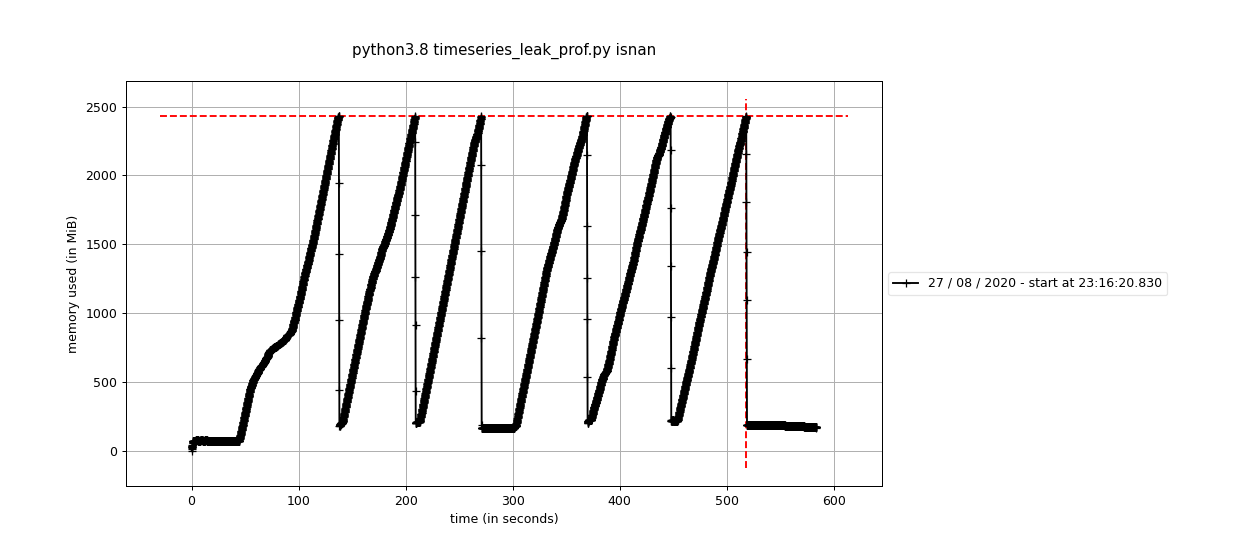
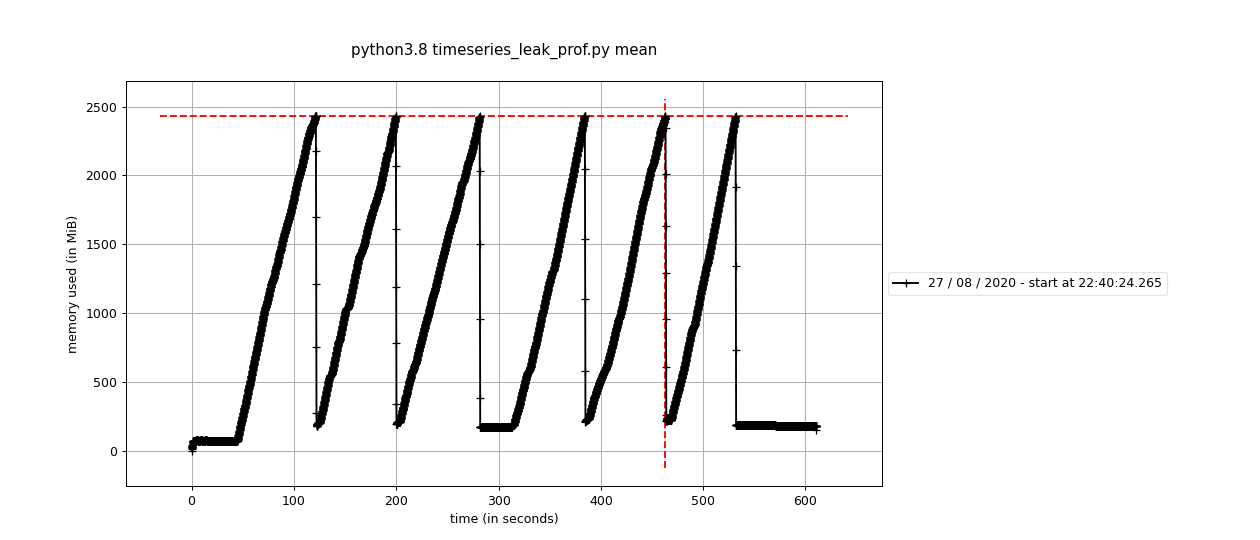
The same operations on an object created as TimeSeries.time for moderately large arrays (length a couple 1000) results in Python running for several minutes and allocating up to several GB (~ len(t) * 200 kB) memory.
Expected behavior
Unsupported functions should raise an exception without undue delay or memory usage of thousands times the original data size, just as for regular Time.
Actual behavior
For a basic TimeSeries like
t = Time(np.arange(10000), format='mjd', scale='tdb')
ts = TimeSeries(time=t)
np.isnan(ts.time)
Traceback (most recent call last):
  File "<stdin>", line 1, in <module>
TypeError: ufunc 'isnan' not supported for the input types, and the inputs could not be safely coerced to any supported types according to the casting rule ''safe''

np.abs(ts.time)
Traceback (most recent call last):
  File "<stdin>", line 1, in <module>
TypeError: bad operand type for abs(): 'Time'
the last two lines each take 30-40 seconds, ramping memory usage multiple times up to > 2 GB as shown in Activity Monitor or top.
Steps to Reproduce
Running the attached script as (pip install memory_profiler) a function is trying to run a function several times first on the original Time object t, then the same as element ts.time of a TimeSeries, a deepcopy(ts.time) of the latter, and again the original t.
> mprof run python3.8 timeseries_leak_prof.py isnan
mprof: Sampling memory every 0.1s
1.19.1
4.1rc2
ufunc 'isnan' not supported for the input types, and the inputs could not be safely coerced to any supported types according to the casting rule ''safe''
Filename: timeseries_leak_prof.py

Line #    Mem usage    Increment   Line Contents
================================================
    11     71.9 MiB     71.9 MiB   @profile
    12                             def np_func(x, func):
    13     71.9 MiB      0.0 MiB       try:
    14     73.2 MiB      1.3 MiB           r = func(x)
    15     73.2 MiB      0.0 MiB       except (TypeError, SystemError) as err:
    16     73.2 MiB      0.0 MiB           print(err)
    17     73.2 MiB      0.0 MiB       return


ufunc 'isnan' not supported for the input types, and the inputs could not be safely coerced to any supported types according to the casting rule ''safe''
Filename: timeseries_leak_prof.py

Line #    Mem usage    Increment   Line Contents
================================================
    11     74.1 MiB     74.1 MiB   @profile
    12                             def np_func(x, func):
    13     74.1 MiB      0.0 MiB       try:
    14    167.2 MiB     93.1 MiB           r = func(x)
    15    167.2 MiB      0.0 MiB       except (TypeError, SystemError) as err:
    16    167.2 MiB      0.0 MiB           print(err)
    17    167.2 MiB      0.0 MiB       return


ufunc 'isnan' not supported for the input types, and the inputs could not be safely coerced to any supported types according to the casting rule ''safe''
Filename: timeseries_leak_prof.py

Line #    Mem usage    Increment   Line Contents
================================================
    11    167.2 MiB    167.2 MiB   @profile
    12                             def np_func(x, func):
    13    167.2 MiB      0.0 MiB       try:
    14    185.8 MiB     18.6 MiB           r = func(x)
    15    185.8 MiB      0.0 MiB       except (TypeError, SystemError) as err:
    16    185.8 MiB      0.0 MiB           print(err)
    17    185.8 MiB      0.0 MiB       return


ufunc 'isnan' not supported for the input types, and the inputs could not be safely coerced to any supported types according to the casting rule ''safe''
Filename: timeseries_leak_prof.py

Line #    Mem usage    Increment   Line Contents
================================================
    11    185.8 MiB    185.8 MiB   @profile
    12                             def np_func(x, func):
    13    185.8 MiB      0.0 MiB       try:
    14    176.4 MiB      0.0 MiB           r = func(x)
    15    176.4 MiB      0.0 MiB       except (TypeError, SystemError) as err:
    16    176.4 MiB      0.0 MiB           print(err)
    17    176.4 MiB      0.0 MiB       return

> mprof run python3.8 timeseries_leak_prof.py mean
mprof: Sampling memory every 0.1s
1.19.1
4.1rc2
Unsupported operand type(s) for +: 'Time' and 'Time'
Filename: timeseries_leak_prof.py

Line #    Mem usage    Increment   Line Contents
================================================
    11     71.5 MiB     71.5 MiB   @profile
    12                             def np_func(x, func):
    13     71.5 MiB      0.0 MiB       try:
    14     77.8 MiB      6.3 MiB           r = func(x)
    15     77.8 MiB      0.0 MiB       except (TypeError, SystemError) as err:
    16     73.1 MiB      0.0 MiB           print(err)
    17     73.1 MiB      0.0 MiB       return


Unsupported operand type(s) for +: 'Time' and 'Time'
Filename: timeseries_leak_prof.py

Line #    Mem usage    Increment   Line Contents
================================================
    11     74.5 MiB     74.5 MiB   @profile
    12                             def np_func(x, func):
    13     74.5 MiB      0.0 MiB       try:
    14   2429.7 MiB   2355.2 MiB           r = func(x)
    15   2429.7 MiB      0.0 MiB       except (TypeError, SystemError) as err:
    16    176.6 MiB      0.0 MiB           print(err)
    17    176.6 MiB      0.0 MiB       return


Unsupported operand type(s) for +: 'Time' and 'Time'
Filename: timeseries_leak_prof.py

Line #    Mem usage    Increment   Line Contents
================================================
    11    176.6 MiB    176.6 MiB   @profile
    12                             def np_func(x, func):
    13    176.6 MiB      0.0 MiB       try:
    14   2430.2 MiB   2253.7 MiB           r = func(x)
    15   2430.2 MiB      0.0 MiB       except (TypeError, SystemError) as err:
    16    185.6 MiB      0.0 MiB           print(err)
    17    185.6 MiB      0.0 MiB       return


Unsupported operand type(s) for +: 'Time' and 'Time'
Filename: timeseries_leak_prof.py

Line #    Mem usage    Increment   Line Contents
================================================
    11    185.6 MiB    185.6 MiB   @profile
    12                             def np_func(x, func):
    13    185.6 MiB      0.0 MiB       try:
    14    176.9 MiB      0.0 MiB           r = func(x)
    15    176.9 MiB      0.0 MiB       except (TypeError, SystemError) as err:
    16    176.7 MiB      0.0 MiB           print(err)
    17    176.7 MiB      0.0 MiB       return
Note that
-
memory_profilerseems to add an additional 5-6 x timing overhead. -
The
mprofoutput does show the memory usage fornp.mean, but not for ufuncs (because it's all allocated inside compiled C extensions?). Howevertopshows similar usage for the latter, as do the attached plots frommprof plot. -
Both for ufuncs and other functions, memory usage failed to trigger the debugger interface running e.g.
python -m memory_profiler --pdb-mmem=200. -
Each of
func(ts.time)andfunc(copy.deepcopy(ts.time))is responsible for 3 successive peaks in memory usage. -
In a Python session memory generally is not immediately released after running functions like
np.meanornp.median, but after anp.ufunc; with older Python or Numpy versions also interpreter segfaults have been observed.
Tested to the same effect with 4.0.1 and current master (including with #10656 merged).
System Details
See above for other Astropy versions tested, also with 4.1rc2 on Pythons 3.6.12, 3.7.9, 3.9.0rc1.
macOS-10.12.6-x86_64-i386-64bit
Python 3.8.5 (default, Jul 22 2020, 22:38:08)
[Clang 9.0.0 (clang-900.0.39.2)]
Numpy 1.19.1
astropy 4.2.dev560+g679a74a46
Scipy 1.5.2
Matplotlib 3.3.0
Activity
taldcroft commentedon Aug 30, 2020
This is clearly a question for @mhvk. Under the hood when this runs I can see that numpy is asking the Time object if it has
__array_interface__,__array_struct__, and__array__attributes. I would have thought it would be trying__array_function__, but this is where I am out of my depth since that is apparently not the case.What does end up happening is that the
__iter__method inutils/shapes.pygets run and numpy converts the one Time object with 10000 elements to 10000 scalar Times, not good. I'm not sure at all what is going on with TimeSeries that makes this expensive (but doable in a second) operation turn into a showstopper.mhvk commentedon Aug 31, 2020
These are ufuncs, so it would try to access
__array_ufunc__-- whichTimecurrently does not have (though @maxnoe is working on it over at #10272). As is, the ufunc creates an object array and then tries to iterate over it.What I completely fail to understand is why the input time
tbehaves differently fromts.time. The latter should just be a copy of the former (both areTimeinstances).But I don't understand
TimeSerieswell enough to know whether anything is changed in the instance. cc @astrofrog.p.s. The difference in timing is also clear in the following in just doing
np.array(t)vsnp.array(ts.time)EDIT: and
np.array(QTable([t], names=['time'])['time'])is not as slow, so it isTimeSeriesspecificdhomeier commentedon Aug 31, 2020
Yes, I had tried to track it down as far as
BaseTimeSeries...The
np.array(t)variation is interesting, as it shows the memory actually seems to be kept in use by the object array. E.g. the memory signature forlooks like this
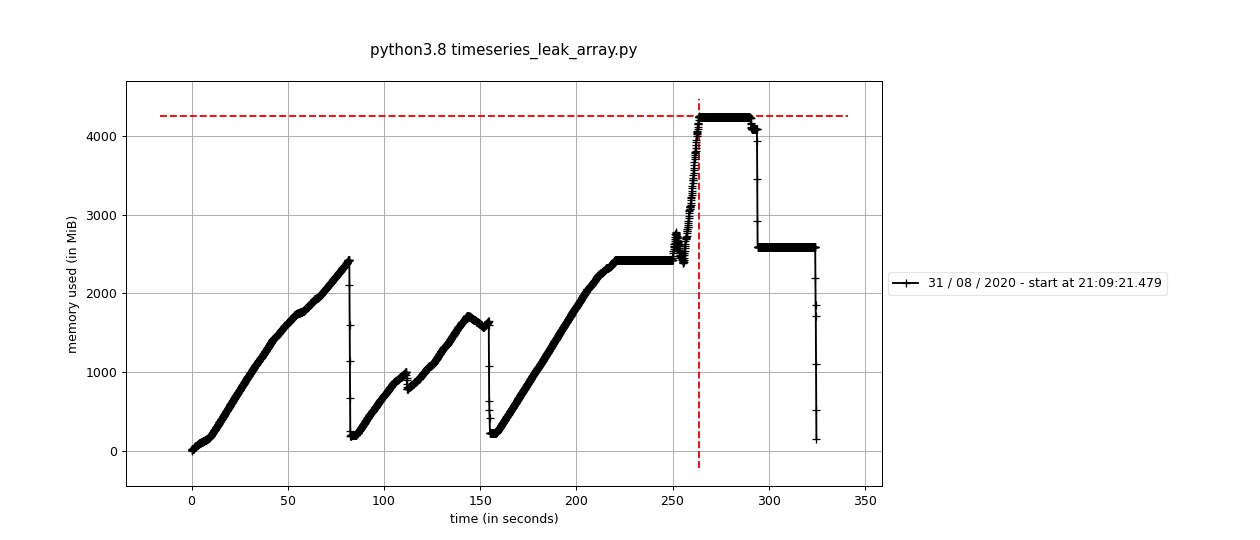
so the excess memory is apparently even copied over.
taldcroft commentedon Aug 31, 2020
I did a debug trace and from what I saw it was not looking for
__array_ufunc__but rather those other three I mentioned. It is certainly possible that I am somehow misinterpreting.mhvk commentedon Sep 1, 2020
Strange, any ufunc should look for
__array_ufunc__.But the strange thing remains the link to
TimeSeries- could it be because it is also the index column? It is probably the submodule I know least about.i-am-b-soto commentedon Oct 9, 2020
¡Hola, ustedes! I found some insight that might be helpful.
In response to @mhvk
So I wrote a script like so:
Indeed it appears just iterating over
timeseries.timetakes longer thantime.I happened to follow the traceback for
index.__deepcopy__it goes something likeshapes.__iter__-->shapes._apply-->time.__applyand in
time._apply, there's this little linetm.info = self.infowhich copies the indecies of the time object!So why is
timeseries.timedifferent fromtime? like @mhvk said, one reason is the index.Timeseries adds an index to the time table on init, specifically in the function
Timeseries.add_coumn()Indeed if I remove this line, and make
Timeseries.timehave no index, I get more similar (though not exact) execution speeds.So I believe
index__deep_copy__is being called for each iteration of timeseries.time, thus slowing down its execution. The reason Time isn't as slow is because it has no index.`
mhvk commentedon Oct 10, 2020
@iamsoto - very nice sleuthing indeed!!
But less sure how to solve this... @taldcroft, any suggestions?
A general question: should the index live on the column rather than on the table? I think it is the only attribute that shares a shape with the host column, which is what makes it problematic - possibly, it needs its own
_applymethod? EDIT: more basic question: should the indices ever be passed on to the result of_apply?Perhaps more simply (though at the risk of treating the symptom rather than the cause), since info can (I think) never be relevant for scalars, one could perhaps guard the copy of
.infowith a shape check, i.e.,taldcroft commentedon Oct 12, 2020
A table index can be on multiple columns, so I think the answer here is no.
taldcroft commentedon Oct 12, 2020
This seems like a sensible idea. So it would appear the memory problems are basically from making N deep copies of an N-long index, which for N=10000 gets bad.
So in
time._applywe could do:This of course has precedent from
Columnwhich dropsinfosincecol[1]just returns the bare numpy scalar or object at index 1.I just tested this and it passes existing tests and in the functional tests above (the original one and one from @iamsoto), there is no difference in performance with or without index.
Who wants to do this PR? 😄
taldcroft commentedon Oct 12, 2020
@iamsoto - in the code you put in, it appears you are using tabs for indentation instead of 4 spaces. That's a pretty big no-no and will cause all kinds of problems if you try to work with most other code besides your own.
i-am-b-soto commentedon Oct 12, 2020
Oh No! sorry.
dhomeier commentedon Oct 12, 2020
Confirm that this also resolves the memory blow-up for the numpy ufuncs. Still takes a long time compared to successfully calling the function on
ts.time.value– I am wondering if there is no way to hand the exception once it is raised on the first element; but the runtime definitely is no longer a show-stopper.mhvk commentedon Oct 13, 2020
I think solving the rest will require implementing
__array_ufunc__- could even do__array_ufunc__ = Noneto just immediately fail. But I suspect that will break code of people relying on things to work via the object-array route (even if very slowly).taldcroft commentedon Oct 17, 2020
I did the proposed fix in #10889.